

The following two graphs display data gathered to test whether the exercise performance of women at high
Question:
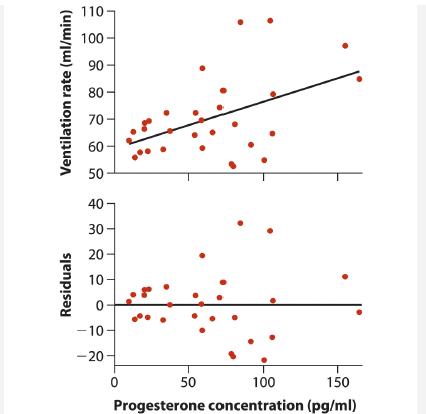
The following two graphs display data gathered to test whether the exercise performance of women at high elevations depends on the stage of their menstrual cycle (Brutsaert et al. 2002). In the upper panel, the explanatory variable is the progesterone level and the response variable is the ventilation rate at submaximal exercise levels. The line is the least squares regression. The lower panel is the corresponding residual plot.
a. What is a “least squares” regression line?
b. What are residuals?
c. Assume that the random sampling assumption is met. By viewing these plots, assess whether each of the three other main assumptions of linear regression is likely to be met in this study.
Step by Step Answer:
a The leastsquares regression line is the one that minimizes t...View the full answer


The Analysis Of Biological Data
ISBN: 9781319226237
3rd Edition
Authors: Michael C. Whitlock, Dolph Schluter
