

According to the data in Figure 1 and Table 1, the average pH in the creek is
Question:
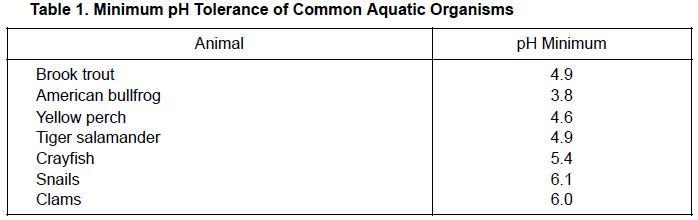
According to the data in Figure 1 and Table 1, the average pH in the creek is most nearly which of the following?
(A) 5.9
(B) 5.5
(C) 5.1
(D) 4.7
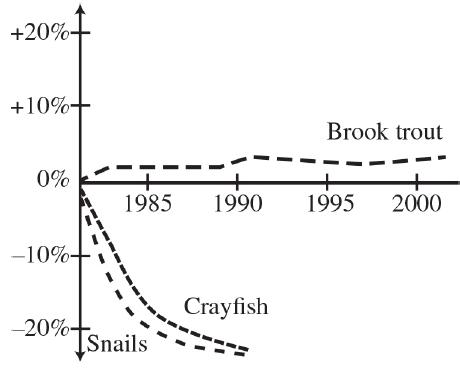
Over the period of 1980 to 2000, the average pH in Richard Creek changed drastically. An ecological survey was performed to evaluate the effect of detectable decreases in pH on the aquatic life of the creek. Four times a year, ecological surveys were performed to identify the number of snails (a primary consumer), crayfish (a secondary consumer), and brook trout (a tertiary consumer) present at five different locations. The percent change relative to 1980 is shown in Figure 1 above. Many aquatic organisms cannot live in low pH conditions. The minimum pH necessary for common aquatic organisms to sustain life is shown in Table 1.
Step by Step Answer:
C Since brook trout can tolerate pH values as low as 49 ...View the full answer


The Princeton Review AP Biology Premium Prep 2023
ISBN: 9780593450659
2023 Edition
Authors: The Princeton Review
