

Obtain charts like those of Figure 6.23 in order to compare values for propane calculated with STANMIX
Question:
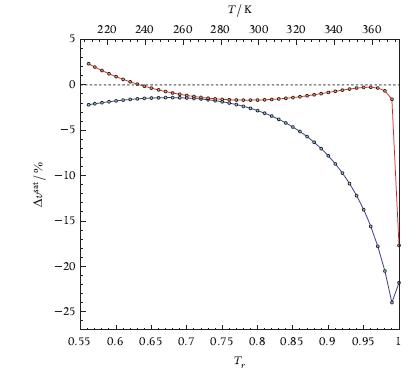
Obtain charts like those of Figure 6.23 in order to compare values for propane calculated with STANMIX and TPSI. What can you infer from these charts about the accuracy of the cubic equation of state model if compared to a multi-parameter thermodynamic model?
Fantastic news! We've Found the answer you've been seeking!
Step by Step Answer:
The percentage difference between the saturation pressure calculated with Stan...View the full answer

Answered By
William Otieno
I am a professional tutor and a writer with excellent skills that are important in serving the bloggers and other specialties that requires a great writer. The important aspects of being the best are that I have served so many clients with excellence
With excellent skills, I have acquired very many recommendations which have made it possible for me to survive as an excellent and cherished writer. Being an excellent content writer am also a reputable IT writer with essential skills that can make one turn papers into excellent result.
83+ Reviews
354+ Question Solved
Related Book For 
Thermodynamics Fundamentals And Engineering Applications
ISBN: 9780521862738
1st Edition
Authors: William C. Reynolds, Piero Colonna
Question Posted:
