Use STANMIX to make a Pxy chart similar to that in Figure 8.20 for the equimolar methanol/water
Question:
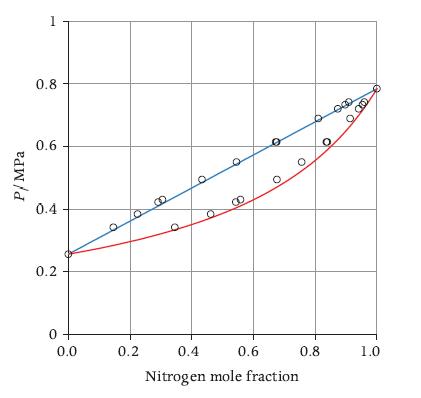
Use STANMIX to make a P–xy chart similar to that in Figure 8.20 for the equimolar methanol/water mixture. Plot the bubble and dew lines for T = 350 K, 375 K, and 400 K.

Transcribed Image Text:
P/MPa 1 0.8 0.6 0.4 0.2 0 0.0 0.2 CD CO 0.4 0.6 Nitrogen mole fraction 0.8 900 om O 0 mm 1.0
Fantastic news! We've Found the answer you've been seeking!
Step by Step Answer:
Answer rating: 50% (8 reviews)
The pxy chart for the methanol water mixt...View the full answer

Answered By

Lamya S
Highly creative, resourceful and dedicated High School Teacher with a good fluency in English (IELTS- 7.5 band scorer) and an excellent record of successful classroom presentations.
I have more than 2 years experience in tutoring students especially by using my note making strategies.
Especially adept at teaching methods of business functions and management through a positive, and flexible teaching style with the willingness to work beyond the call of duty.
Committed to ongoing professional development and spreading the knowledge within myself to the blooming ones to make them fly with a colorful wing of future.
I do always believe that more than being a teacher who teaches students subjects,...i rather want to be a teacher who wants to teach students how to love learning..
Subjects i handle :
Business studies
Management studies
Operations Management
Organisational Behaviour
Change Management
Research Methodology
Strategy Management
Economics
Human Resource Management
Performance Management
Training
International Business
Business Ethics
Business Communication
Things you can expect from me :
- A clear cut answer
- A detailed conceptual way of explanation
- Simplified answer form of complex topics
- Diagrams and examples filled answers
4.90+
46+ Reviews
54+ Question Solved
Related Book For 

Thermodynamics Fundamentals And Engineering Applications
ISBN: 9780521862738
1st Edition
Authors: William C. Reynolds, Piero Colonna
Question Posted:
Students also viewed these Engineering questions
-
Use STANMIX to make a Ts chart similar to that in Figure 8.1 for the equimolar methanol/water mixture. Plot two iso-lines for each type, that is, isobar, isochore, isenthalp, iso-quality. T/C 200 150...
-
The following additional information is available for the Dr. Ivan and Irene Incisor family from Chapters 1-5. Ivan's grandfather died and left a portfolio of municipal bonds. In 2012, they pay Ivan...
-
A fluid formed by pentane and hexane obeys Raoults law quite well. Such a mixture can be used for example as the working fluid of an organic Rankine cycle power plant. The vapor pressure of pure...
-
Dun and Bradstreet have reported that nearly half of all Australian businesses operated with a negative cash flow over recent financial years. This figure is worrying as 80% of business failures are...
-
You just received a shipment of 10 DVD players. One DVD player is defective. You will accept the shipment if two randomly selected DVD players work. What is the probability that you will accept the...
-
The demand for erasers (Q) is given as follows: Q = 240 - 4Pe + 2I + Pb + A where Pe is the price of erasers. I is the income level. Pb is the price of another good. A is the advertising level....
-
Use the data set, which represents the ages of 30 executives. Which ages are below the 75th percentile? 43 57 65 47 57 41 56 53 61 54 56 50 66 56 50 61 47 40 50 43 54 41 48 45 28 35 38 43 42 44
-
On May 2, 2019, HPF Vacations received its April bank statement from First City Bank and Trust. Enclosed with the bank statement, which appears below, was a debit memorandum for $160 that covered an...
-
Thomas Company began its operations in 2 0 2 7 and applies overhead costs to jobs using a pre - determined overhead rate equal to 6 0 % of direct labor cost. During 2 0 2 7 , Thomas Company began...
-
How would the companys cash needs change for the company in Examples 14-1 to 14-5 if the third project started in May instead of February and the retention was not released until the following year?
-
Given the set of VLE experimental data for the non-ideal mixture propane/n-pentane at 344.26 K from B. Sage and W. Lacey, Phase equilibria in hydrocarbon systems, propanen- pentane system, Industrial...
-
A generic partial molar property is defined as where can be v, h, s,u, g, . . . ; if you are hasty, you might wrongly conclude that = (), a Ni T.P.N = (N) a Ni T,P.Ng
-
Suppose that two deuterium nuclei ( 1 H 2 ) combine in a fusion reaction in which a neutron is emitted. Complete the reaction equation and identify the resulting nucleus. 1 H 2 + 1 U 2 ? + 0 n 1
-
Paragraph Effective Presentation Skills post pandamic like zoom platform how it changed to new ways 1 source?
-
Calculate cost of capital of a stock according to CAPM model if risk-free rate is 8% , market return 12% and Beta of stock 1.5.
-
watch this video: Why human microchipping is so popular in Sweden | ITV News and the answer if is this a useful practice or a harmful practice. Please explain why or why not.
-
Find a specific example of when a sensitivity analysis might be used. Explain why it is needed in this situation.
-
At the end of three years, how much is an initial deposit of $100 worth, assuming annual interest rate of 10 percent compounded semiannually?
-
A bond with a face value of $1000 and 15 years remaining until maturity pays a coupon rate of 5%. Calculate its yield to maturity if it is priced at $900.
-
Propose a reasonable mechanism for the following reaction. OH
-
A Swiss watchmaker states in a flyer the mechanical power PW dissipated by a specific clock (Fig. 2.10). The work provided to the clock is due to the temperature Figure 2.10 A clock receives its...
-
A state of an elastic rod is described by the state variables entropy S and length L. The differential of the internal energy U(S, L) of the rod is written as, Note that f (S, L) has the units of a...
-
Three processes are performed on a gas from a state given by (p 1 , V 1 ) to a state given by (p 2 , V 2 ) :a) An isochoric process followed by an isobaric process,b) An isobaric process followed by...
-
Describe a potential case scenario involving an MSN-prepared nurse in leadership and management. Within the scenario, address the concern conflict between team members that can impact your future MSN...
-
Answer all parts in full detail. Part 1 Identify 3-5 activities that you would like to include in the professional development plan as a public-sector employee. Discuss at least 2 activities from...
-
Explain the PMO organizational structure, the rationale for its make-up, and how this configuration can be used to accomplish the goals of the project. Will project managers be included in the PMO,...

Study smarter with the SolutionInn App


