

Table 2.13 shows a data set containing information for 45 mutual funds that are part of the
Question:
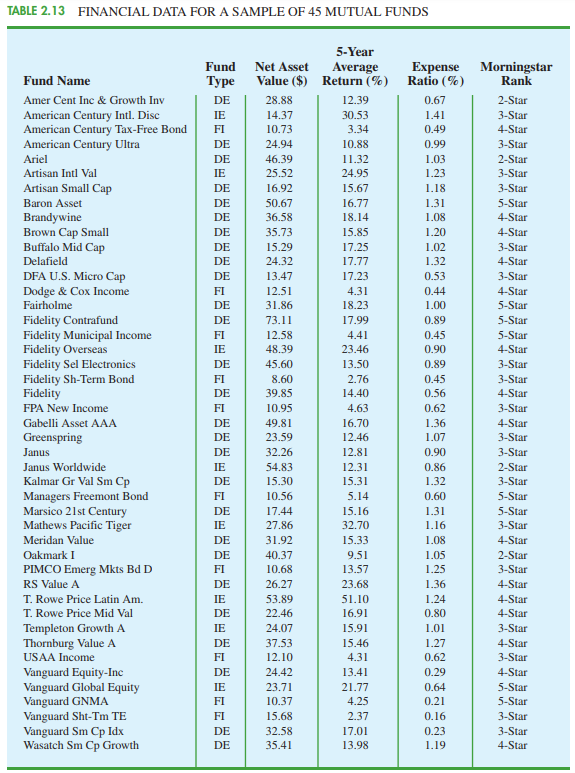
Table 2.13 shows a data set containing information for 45 mutual funds that are part of the Morningstar Funds 500 for 2008. The data set includes the following five variables:
Fund Type: The type of fund, labeled DE (Domestic Equity), IE (International Equity), and FI (Fixed Income)
Net Asset Value ($): The closing price per share
5-Year Average Return (%): The average annual return for the fund over the past 5 years
Expense Ratio (%): The percentage of assets deducted each fiscal year for fund expenses
Morningstar Rank: The risk adjusted star rating for each fund; Morningstar ranks go from a low of 1-Star to a high of 5-Stars
a. Prepare a cross tabulation of the data on Fund Type (rows) and the average annual return over the past 5 years (columns). Use classes of 0-9.99, 10-19.99, 20-29.99, 30-39.99, 40-49.99, and 50-59.99 for the 5-Year Average Return (%).
b. Prepare a frequency distribution for the data on Fund Type.
c. Prepare a frequency distribution for the data on 5-Year Average Return (%).
d. How has the cross tabulation helped in preparing the frequency distributions in parts (b) and (c)?
e. What conclusions can you draw about the fund type and the average return over the past 5 years?
The word "distribution" has several meanings in the financial world, most of them pertaining to the payment of assets from a fund, account, or individual security to an investor or beneficiary. Retirement account distributions are among the most...
Step by Step Answer:
a 5 Year Average Return Fund Type 0999 101999 202999 303999 4...View the full answer


Essentials Of Modern Business Statistics With Microsoft Excel
ISBN: 9780840062383
5th Edition
Authors: David R. Anderson, Dennis J. Sweeney, Thomas A. Williams
