

The author surveyed students in one of his statistics classes about the number of hours they worked
Question:
The author surveyed students in one of his statistics classes about the number of hours they worked per week. The density histogram in Fig. 17 describes their responses.
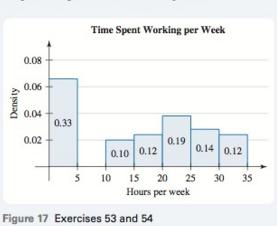
For a randomly selected student in the class, let X be the number of hours the student works per week.
a. Find P(X ≥ 25).
b. Find P(X < 20).
c. Find P(15 ≤ X < 30).
d. Describe the shape of the distribution.
e. Rather than use the mean or the median to estimate the center of the entire distribution, explain why it would be more meaningful to separate the data into two groups and estimate the center of each group.
Fantastic news! We've Found the answer you've been seeking!
Step by Step Answer:
a b c dThe distribution is ...View the full answer

Answered By
Sigei Kipngeno
I am a professional writer with more than 2 years of writing experience. I will always deliver a grade A paper with zero plagiarism . Thanks in advance.
175+ Reviews
311+ Question Solved
Related Book For 

Question Posted:
