

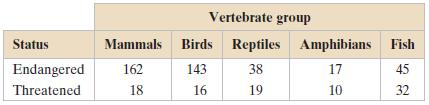
The contingency table shows the results of a random sample of endangered and threatened species by status
Question:
The contingency table shows the results of a random sample of endangered and threatened species by status and vertebrate group. At α = 0.01, test the hypothesis that the variables are independent.
(a) Find the expected frequency for each cell in the contingency table,
(b) Identify the claim and state H0 and Ha,
(c) Determine the degrees of freedom, find the critical value, and identify the rejection region,
(d) Find the chi-square test statistic,
(e) Decide whether to reject or fail to reject the null hypothesis,
(f) Interpret the decision in the context of the original claim. If convenient, use technology.
Fantastic news! We've Found the answer you've been seeking!
Step by Step Answer:
a Expected frequencies b The claim is the species status endangered or ...View the full answer

Answered By
Madhur Jain
I have 6 years of rich teaching experience in subjects like Mathematics, Accounting, and Entrance Exams preparation. With my experience, I am able to quickly adapt to the student's level of understanding and make the best use of his time.
I focus on teaching concepts along with the applications and what separates me is the connection I create with my students. I am well qualified for working on complex problems and reaching out to the solutions in minimal time. I was also awarded 'The Best Tutor Award' for 2 consecutive years in my previous job.
Hoping to get to work on some really interesting problems here.
1+ Reviews
10+ Question Solved
Related Book For 

Elementary Statistics Picturing The World
ISBN: 9780321911216
6th Edition
Authors: Ron Larson, Betsy Farber
Question Posted:
