

The following cost graphs illustrate various types of cost behavior: For each of the following costs, identify
Question:
The following cost graphs illustrate various types of cost behavior:
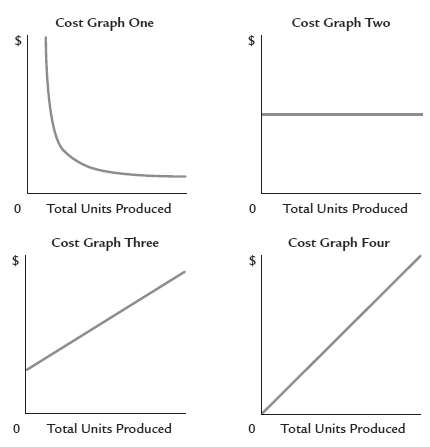
For each of the following costs, identify the cost graph that best illustrates its cost behavior as the number of units produced increases.(a) Total direct materials cost(b) Electricity costs of $2,000 per month plus $0.09 per kilowatt-hour(c) Per-unit direct labor cost(d) Salary of quality control supervisor, $10,000 per month(e) Per-unit cost of straight-line depreciation on factory equipment
Fantastic news! We've Found the answer you've been seeking!
Step by Step Answer:
a Cost Graph Four ...View the full answer

Answered By
Utsab mitra
I have the expertise to deliver these subjects to college and higher-level students. The services would involve only solving assignments, homework help, and others.
I have experience in delivering these subjects for the last 6 years on a freelancing basis in different companies around the globe. I am CMA certified and CGMA UK. I have professional experience of 18 years in the industry involved in the manufacturing company and IT implementation experience of over 12 years.
I have delivered this help to students effortlessly, which is essential to give the students a good grade in their studies.
2+ Reviews
10+ Question Solved
Related Book For 

Question Posted:
