

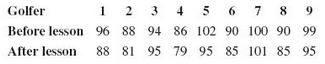
The following table shows the golf scores of nine people before and after a lesson given by
Question:
The following table shows the golf scores of nine people before and after a lesson given by the golf professional at Pike Creek Golf Club. These data can also be found in the Excel file lessons. xlsx.
a. Using α = 0.05, test the professional’s claim that the average golfer will lower his or her score by more than two strokes after a lesson.
b. Approximate the p value using Table 5 in Appendix A and interpret the result.
c. Construct a 90% confidence interval to estimate the average reduction in golf scores after the lesson. Interpret the results.
d. Verify your results using Excel’s Data Analysis. Mac users can rely on PHStat for this procedure.
e. Identify the p value using Excel and interpret the result.
f. What assumptions need to be made in order to perform this procedure?
Step by Step Answer:
a There is enough evidence to conclude that the average golfe...View the full answer


