

The Human Resource Department at Neumann University would like to examine the linear relationship between a faculty
Question:
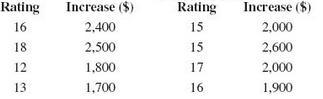
The Human Resource Department at Neumann University would like to examine the linear relationship between a faculty member’s performance rating (measured on a scale of 1– 20) and his or her annual salary increase. The following table shows these data for eight randomly selected faculty members and can also be found in the Excel file Neumann. xlsx.
a. Construct a scatter plot for these data using Excel.
b. Using α = 0.05, determine if the slope for the regression equation is statistically significant.
Fantastic news! We've Found the answer you've been seeking!
Step by Step Answer:
a b Increase ...View the full answer

Answered By
Muhammad Umair
I have done job as Embedded System Engineer for just four months but after it i have decided to open my own lab and to work on projects that i can launch my own product in market. I work on different softwares like Proteus, Mikroc to program Embedded Systems. My basic work is on Embedded Systems. I have skills in Autocad, Proteus, C++, C programming and i love to share these skills to other to enhance my knowledge too.
1+ Reviews
10+ Question Solved
Related Book For 

Question Posted:
