

The table shows the costs per ounce (in dollars) for a sample of toothpastes exhibiting very good
Question:
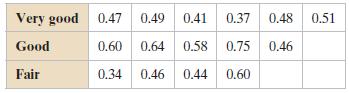
The table shows the costs per ounce (in dollars) for a sample of toothpastes exhibiting very good stain removal, good stain removal, and fair stain removal. At α = 0.05, can you conclude that at least one mean cost per ounce is different from the others?
(a) Identify the claim and state H0 and Ha,
(b) Find the critical value and identify the rejection region,
(c) Find the test statistic F,
(d) Decide whether to reject or fail to reject the null hypothesis,
(e) Interpret the decision in the context of the original claim. Assume the samples are random and independent, the populations are normally distributed, and the population variances are equal. If convenient, use technology.
Step by Step Answer:
a The claim is that the mean costs per ounce are different H 0 1 2 3 H a At least one mean is di...View the full answer


Elementary Statistics Picturing The World
ISBN: 9780321911216
6th Edition
Authors: Ron Larson, Betsy Farber
