

The table shows the weights (in pounds) for a sample of vacuum cleaners. The weights are classified
Question:
The table shows the weights (in pounds) for a sample of vacuum cleaners. The weights are classified according to vacuum cleaner type. At α = 0.01, can you conclude that at least one mean vacuum cleaner weight is different from the others?
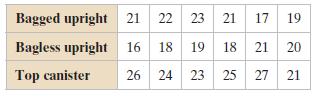
(a) Identify the claim and state H0 and Ha,
(b) Find the critical value and identify the rejection region,
(c) Find the test statistic F,
(d) Decide whether to reject or fail to reject the null hypothesis,
(e) Interpret the decision in the context of the original claim. Assume the samples are random and independent, the populations are normally distributed, and the population variances are equal. If convenient, use technology.
Fantastic news! We've Found the answer you've been seeking!
Step by Step Answer:
a The claim is at least one mean vacuum cleaner weig...View the full answer

Answered By
Paul Muriku
In my extensive history of working on students’ assignments, I have learned one thing: Each assignment must be custom-made and should stand on its own merits. No essay will ever reach its full potential if it’s being worked on by a disinterested person. I am a passionate essay writer with more than seven years of experience. I have handled clients from Europe, America, and Asia. For the past few years, I have endeared myself to students across the globe for excellence and quality that I guarantee. I have written thousands of Ivy papers in different styles like APA, MLA, Harvard, Chicago, and IEEE for many students on a wide range of subjects such as computer science, IT, agriculture, business, communication, media studies, law, education, psychology, liberal arts and humanities, medicine and health, and biological sciences. I am a person who relishes to attempt and discover the most effective solutions for problems I encounter. I am a self-motivated individual who has attempted to establish his own personal philosophy in both work environments and leisure pursuits, and then apply this to any situation I encounter. I am greatly inspired by a wide range of genres including dancing styles, futuristic styles, color combinations, book passages, comedy performance, artworks, and writing styles and I always attempt to utilize them as a source of influence in my writings. Freelancing has helped me to demonstrate my excellent multitasking and organizational skills, as well as my ability to manage all tasks with the pressure of deadlines. My exceptional time management and focus skills enable me to work autonomously, despite any potential interference and provide best essays and assignments any time of the day. I have garnered an abundance of experience in collecting accompanying information for articles from online platforms. I have worked with a team of editors involved in task editing and fact checking, which has perfected my attention to detail and command of grammar and syntax.
0 Reviews
10+ Question Solved
Related Book For 

Elementary Statistics Picturing The World
ISBN: 9780321911216
6th Edition
Authors: Ron Larson, Betsy Farber
Question Posted:
