

The table shows the numbers of new-vehicle sales (in thousands) in the United States for Toyota and
Question:
The table shows the numbers of new-vehicle sales (in thousands) in the United States for Toyota and Honda for 11 years. The equation of the regression line is ŷ = 0.396x + 536.161.
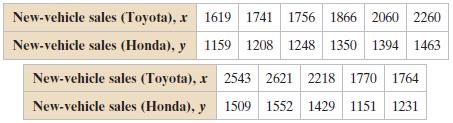
Use the data to find
(a) The coefficient of determination r2 and interpret the result,
(b) The standard error of estimate se and interpret the result.
Fantastic news! We've Found the answer you've been seeking!
Step by Step Answer:
a About 910 of the variation in the newvehicle sales of Honda can be exp...View the full answer

Answered By
Carly Cimino
As a tutor, my focus is to help communicate and break down difficult concepts in a way that allows students greater accessibility and comprehension to their course material. I love helping others develop a sense of personal confidence and curiosity, and I'm looking forward to the chance to interact and work with you professionally and better your academic grades.
12+ Reviews
21+ Question Solved
Related Book For 

Elementary Statistics Picturing The World
ISBN: 9780321911216
6th Edition
Authors: Ron Larson, Betsy Farber
Question Posted:
