

The table shows the salaries of a sample of individuals from six large metropolitan areas. At
Question:
The table shows the salaries of a sample of individuals from six large metropolitan areas. At α = 0.05, can you conclude that the mean salary is different in at least one of the areas?
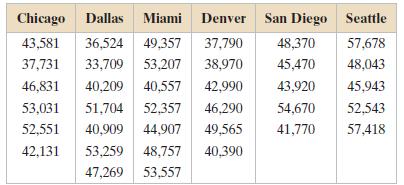
(a) Identify the claim and state H0 and Ha,
(b) Find the critical value and identify the rejection region,
(c) Find the test statistic F,
(d) Decide whether to reject or fail to reject the null hypothesis,
(e) Interpret the decision in the context of the original claim. Assume the samples are random and independent, the populations are normally distributed, and the population variances are equal. If convenient, use technology.
Fantastic news! We've Found the answer you've been seeking!
Step by Step Answer:
a The claim is the mean salary is different in at le...View the full answer

Answered By
SUMAN DINDA
I LIKE TO TEACH STUDENTS. SO, I START MYSELF AS A PRIVATE TUTOR. I TEACH STUDENTS OF DIFFERENT CLASSES. I HAVE ALSO DONE BACHELOR OF EDUCATION DEGREE(B.ED). DURING THIS COURSE I HAD TO TEACH IN A SCHOOL. SO I HAVE A GOOD EXPERIENCE IN TEACHING.
1+ Reviews
10+ Question Solved
Related Book For 

Elementary Statistics Picturing The World
ISBN: 9780321911216
6th Edition
Authors: Ron Larson, Betsy Farber
Question Posted:
