

The table shows the sale prices (in thousands of dollars) of a sample of one-family houses in
Question:
The table shows the sale prices (in thousands of dollars) of a sample of one-family houses in three cities. At α = 0.10, can you conclude that at least one mean sale price is different from the others?
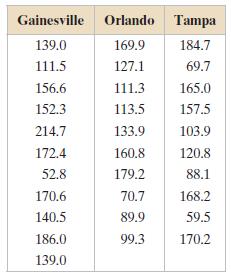
(a) Identify the claim and state H0 and Ha,
(b) Find the critical value and identify the rejection region,
(c) Find the test statistic F,
(d) Decide whether to reject or fail to reject the null hypothesis,
(e) Interpret the decision in the context of the original claim. Assume the samples are random and independent, the populations are normally distributed, and the population variances are equal. If convenient, use technology.
Fantastic news! We've Found the answer you've been seeking!
Step by Step Answer:
a The claim is at least one mean sale price is diff...View the full answer

Answered By
Branice Buyengo Ajevi
I have been teaching for the last 5 years which has strengthened my interaction with students of different level.
1+ Reviews
10+ Question Solved
Related Book For 

Elementary Statistics Picturing The World
ISBN: 9780321911216
6th Edition
Authors: Ron Larson, Betsy Farber
Question Posted:
