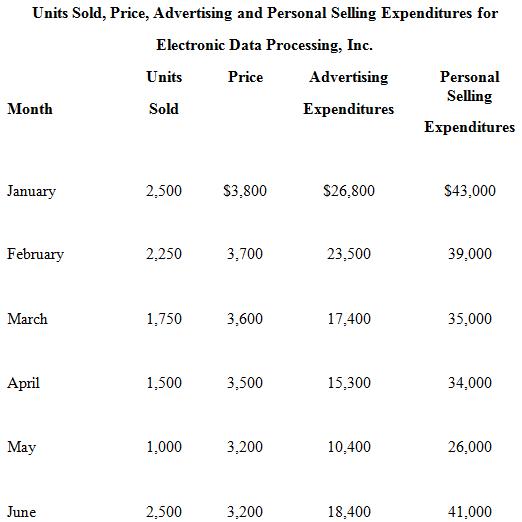
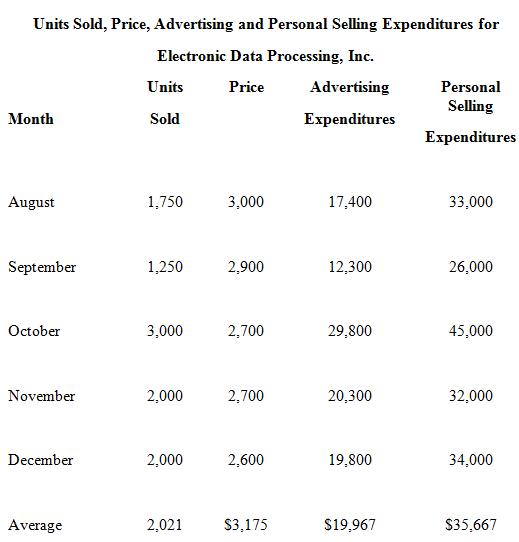
The use of regression analysis for demand estimation can be further illustrated by expanding the Electronic Data
Question:
.:.
If a linear relation between unit sales, contract price, advertising, and personal selling expenditures is hypothesized, the EDP regression equation takes the following form:
![]()
where Y is the number of contracts sold, P is the average contract price per month, AD is advertising expenditures, PSE is personal selling expenses, and u is a random disturbance term--all measured on a monthly basis over the past year.
When this linear regression model is estimated over the EDP data, the following regression equation is estimated (t-statistics in parentheses):
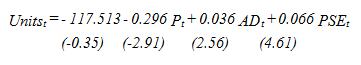
Where Pt is price, Add is advertising, Pest is selling expense, and statistics are indicated within parentheses. The standard error of the estimate or SEE is 123.9 units, the coefficient of determination or R2 = 97.0%, the adjusted coefficient of determination is R̅2 = 95.8%, and the relevant F statistic is 85.4.
A. What is the economic meaning of the b0 = ‑117.513 intercept term? How would you interpret the value for each independent variable's coefficient estimate?
B. How is the standard error of the estimate (SEE) employed in demand estimation?
C. Describe the meaning of the coefficient of determination, R2, and the adjusted coefficient of determination, R̅2.
D. Use the EDP regression model to estimate fitted values for units sold and unexplained residuals for each month during the year.
Step by Step Answer:
A The intercept term b 0 117513 has no clear economic meaning Caution must always be exercised when interpreting points outside the range of observed data and this intercept like most lies far from ty...View the full answer