

The wave function for the hydrogen-atom quantum state represented by the dot plot shown in figure, which
Question:
The wave function for the hydrogen-atom quantum state represented by the dot plot shown in figure, which has n = 2 and ? = m? = 0, is in which a is the Bohr radius and the subscript on ?(r) gives the values of the quantum numbers n, ?, m?.(a) Plot ?2200(r) and show that your plot is consistent with the dot plot of figure.(b) Show analytically that ?2200(r) has a maximum at r = 4a.(c) Find the radial probability density P200(r) for this state.(d) Show that and thus that the expression above for the wave function ?200(r) *zo6(r) has been properly normalized.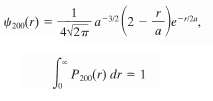
Fantastic news! We've Found the answer you've been seeking!
Step by Step Answer:
a The plot shown below for 200 is to be compared with the dot plot of Fig 3922 We note that the hori...View the full answer

Answered By
Zablon Gicharu
I am an educator who possesses the requisite skills and knowledge due to interacting with students for an extended period. I provide solutions to various problems in step-by-step explanations, a well-thought approach and an understandable breakdown. My goal is to impart more straightforward methodologies and understanding to students for more remarkable achievements.
4+ Reviews
10+ Question Solved
Related Book For 
Probability & Statistics For Engineers & Scientists
ISBN: 9780130415295
7th Edition
Authors: Ronald E. Walpole, Raymond H. Myers, Sharon L. Myers, Keying
Question Posted:
