

Use the appropriate graphtime-series, croos-sectional, or scatter diagramto illustrate the economic data provided in each apart below.
Question:
Use the appropriate graph—time-series, croos-sectional, or scatter diagram—to illustrate the economic data provided in each apart below.
a. The Canadian-dollar price of one U.S. dollar (the “exchange rate”) in 2011:
January…………………………………0.994
February………………………………..0.988
March…………………………………..0.977
April……………………………………0.958
May…………………………………….0.968
June…………………………………….0.977
July……………………………………..0.956
August………………………………….0.982
September………………………………1.003
October…………………………………1.019
November………………………………1.026
December………………………………1.024
b. A comparison of average household expenditures across provinces in 2010:
British Columbia……………………..$72 486
Alberta ……………………..………….84 087
Saskatchewan…………………………69 237
Manitoba………………………………66 330
Ontario………………………………...74 521
Quebec………………………………..61 536
New Brunswick………………………59 943
Nova Scotia…………………………..61 907
Prince Edward Island………………..58 194
Newfoundland and Labrador……….60 139
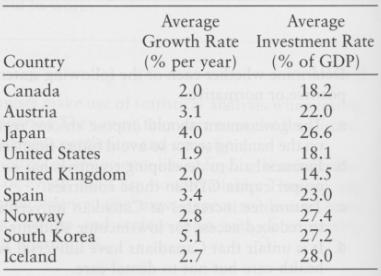
c. Per capita growth rates of real GDP and investment rates for various countries, averaged over the period 1950-2009:
Step by Step Answer:
a These data are best illustrated with a timeseries g...View the full answer


Microeconomics
ISBN: 978-0321866349
14th canadian Edition
Authors: Christopher T.S. Ragan, Richard G Lipsey
