

Kim Brite and Larry Short have developed a series of exclusive mobile-home parks in which each unit
Question:
Assuming that Kim Brite and Larry Short have hired you as a forecasting consultant:
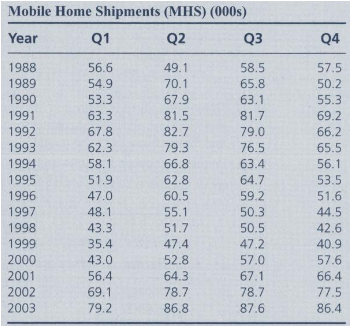
a. Provide a time-series plot of the actual MHS data along with the deseasonalized data. Write a brief memo in which you report the nature and extent of the seasonality in the data. Include seasonal indices in your report.
b. Develop a long-term linear trend for the data, based on the centered moving averages. Let time equal 1 for 1988Q1 in your trend equation. On the basis of this trend, does the future look promising for Brite and Short?
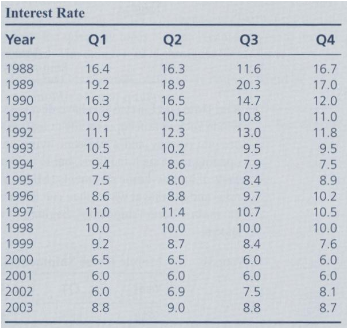
c. One of the things Ms. Brite and Mr. Short are concerned about is the degree to which MHS is subject to cyclical fluctuations. Calculate cycle factors and plot them in a time-series graph, including projections of the cycle factor through 2004. In evaluating the cycle factor, sec whether interest rates appear to have any effect on the cyclical pattern. The rate for 1988Q1 through 2003Q4 is provided in the following table, should you wish to use this measure of interest rates.
d. Demonstrate for Ms. Brite and Mr. Short how well your time-series decomposition model follows the historical pattern in the data by plotting the actual values of MHS and those estimated by the model in a single time-series plot.
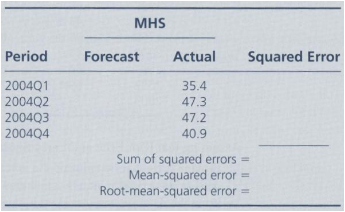
e. Prepare a forecast for 2004 and calculate the root-mean-squared error (RMSE), given the actual values of MHS for 2004 shown:
Step by Step Answer:
tr msoheightsourceauto col msowidthsourceauto br msodataplacementsamecell style0 msonumberformatGeneral textaligngeneral verticalalignbottom whitespacenowrap msorotate0 msobackgroundsourceauto msopatt...View the full answer


Business Forecasting with Forecast X
ISBN: 978-0073373645
6th edition
Authors: Holton wilson, barry keating, john solutions inc
