

The graph is a scatter plot with 8 points, each representing the low temperature and high temperature
Question:
The graph is a scatter plot with 8 points, each representing the low temperature and high temperature of 8 days in September in a certain city. Both the low temperatures and high temperatures are measured in degrees Fahrenheit. The line of best fit for the data is also shown.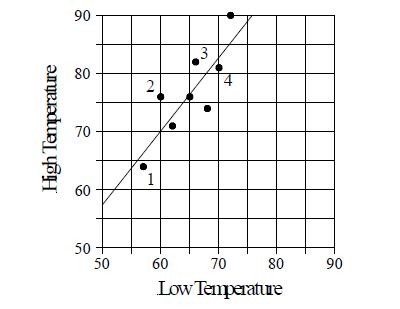 Among the four days marked 1, 2, 3, and 4 in the scatter plot, on which day is the difference between the high temperature and the low temperature minimal?
A) Day 1
B) Day 2
C) Day 3
D) Day 4
Fantastic news! We've Found the answer you've been seeking!
Step by Step Answer:
A In Day 1 the approximate high temperature is 64 and the ...View the full answer

Answered By
Hassan Ali
I am an electrical engineer with Master in Management (Engineering). I have been teaching for more than 10years and still helping a a lot of students online and in person. In addition to that, I not only have theoretical experience but also have practical experience by working on different managerial positions in different companies. Now I am running my own company successfully which I launched in 2019. I can provide complete guidance in the following fields. System engineering management, research and lab reports, power transmission, utilisation and distribution, generators and motors, organizational behaviour, essay writing, general management, digital system design, control system, business and leadership.
1+ Reviews
10+ Question Solved
Related Book For 

Question Posted:
