

The graph is a scatter plot with 8 points, each representing the low temperature and high temperature
Question:
The graph is a scatter plot with 8 points, each representing the low temperature and high temperature of 8 days in September in a certain city. Both the low temperatures and high temperatures are measured in degrees Fahrenheit. The line of best fit for the data is also shown.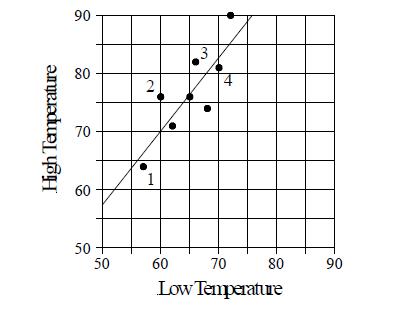
Based on the line of best fit for the data shown, how many degrees does the high temperature increase when the low temperature increases by one degree?
A) 0.9
B) 1.3
C) 1.6
D) 1.8
Fantastic news! We've Found the answer you've been seeking!
Step by Step Answer:
B High Temperature 90 80 70 60 50 50 2 1 60 70 Low Temperature 80 9...View the full answer

Answered By
Mehwish Aziz
What I have learnt in my 8 years experience of tutoring is that you really need to have a friendly relationship with your students so they can come to you with their queries without any hesitation. I am quite hardworking and I have strong work ethics. Since I had never been one of those who always top in the class and always get A* no matter what, I can understand the fear of failure and can relate with my students at so many levels. I had always been one of those who had to work really hard to get decent grades. I am forever grateful to some of the amazing teachers that I have had who made learning one, and owing to whom I was able to get some extraordinary grades and get into one of the most prestigious universities of the country. Inspired by those same teachers, I am to be like one of them - who never gives up on her students and always believe in them!
3+ Reviews
10+ Question Solved
Related Book For 

Question Posted:
