

The graph is a scatter plot with 8 points, each representing the low temperature and high temperature
Question:
The graph is a scatter plot with 8 points, each representing the low temperature and high temperature of 8 days in September in a certain city. Both the low temperatures and high temperatures are measured in degrees Fahrenheit. The line of best fit for the data is also shown.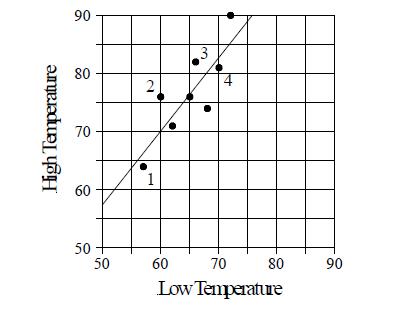 What is the predicted high temperature of the day when the low temperature is 58?
A) 65
B) 68
C) 71
D) 74
Fantastic news! We've Found the answer you've been seeking!
Step by Step Answer:
B When the low temperature is 5...View the full answer

Answered By
Nidhi pandey
Hi as mentioned I am Delhi ( India ) based person and qualified my Chartered Accountant degree in 2002.. I worked for various organisations in various departments . I have worked in many educational institutions ( commerce ). My core subjects of expertise are accounting, financial management, cost accounting, banking , income tax and insurance.
I have a teaching experience of more than 15years . My expertise subjects are accounts, income tax , cost accounting, banking, insurance, financial management and financial accounting.
I have not only helped thousand students to improve their knowledge but to develop their expertise in core subjects such as accounting, maths , cost accounting, banking, financial management.
My core objective is to improve the academic growth of students at solution inn as well.
0 Reviews
10+ Question Solved
Related Book For 

Question Posted:
