

A study records the overall preference for a product (How would you rate this product?) and attitudes
Question:
A study records the overall preference for a product (“How would you rate this product?”) and attitudes towards the price of a product (“It is a fair price”). The result is the crosstab in Fig. 9.51.
Figure 9.51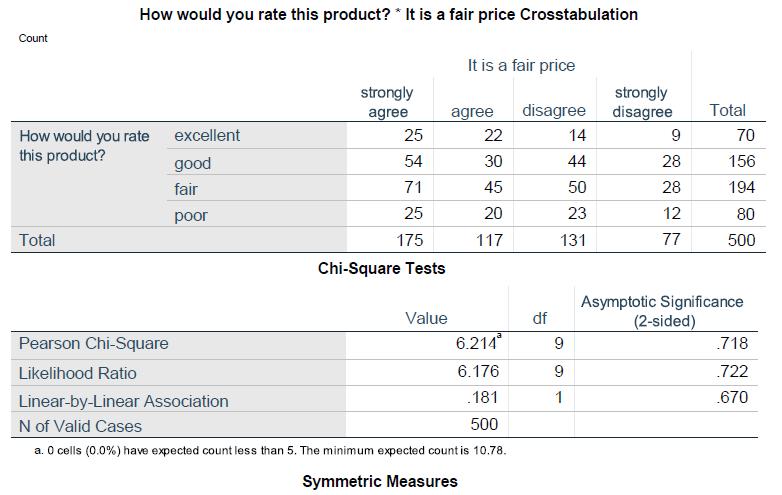
(a) What per cent of respondents who rated the product as poor strongly disagree with the statement “It is a fair price”?
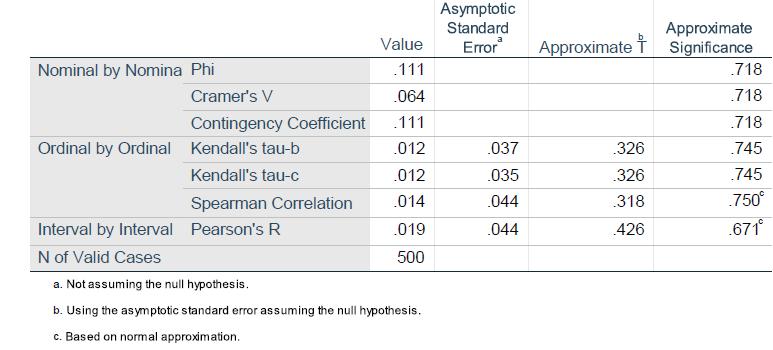
(b) Is the relationship significant? To answer this question, assess the coefficients Phi, Cramer’s V, Contingency Coefficient, and Kendall’s Tau.
(c) After a product presentation, the same subjects are asked about their attitude to the price of the product (“After product presentation: It is a fair price”) on a scale from one (“strongly agree”) to four (“strongly disagree”). Their responses are then subject to a statistical test. Interpret the results from Fig. 9.52.
Figure 9.52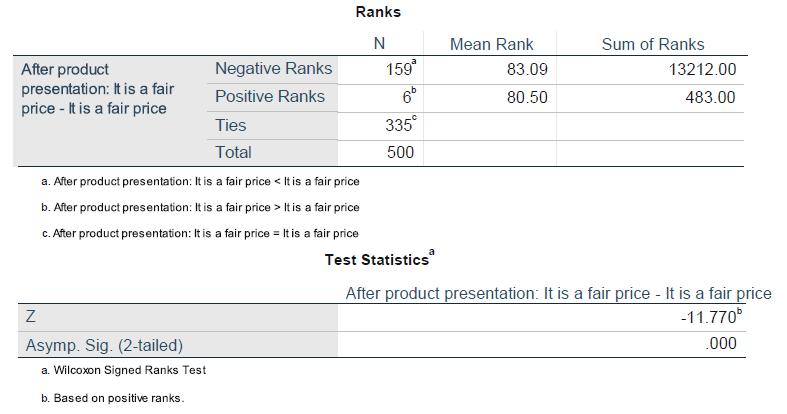
(d) Their responses are now tested again but this time using a different procedure.
Interpret the results in Fig. 9.53. Is there a nonparametric way to analyse the change in preferences here?
Figure 9.53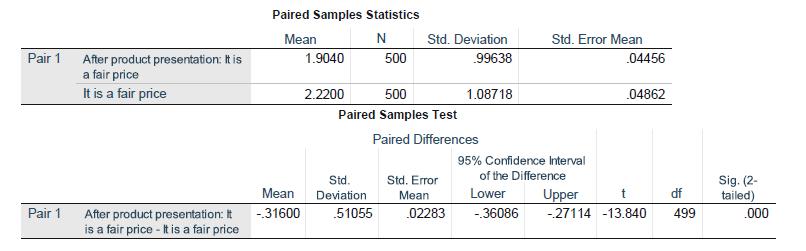
Step by Step Answer:
a The percentage is p 1280 15 b This case involves two ordinal scale variables each capable of havin...View the full answer


Applied Statistics And Multivariate Data Analysis For Business And Economics
ISBN: 9783030177669
1st Edition
Authors: Thomas Cleff
