

Consider the concentration data in Exercise 15-76. Use = 8 and assume that the desired process
Question:
Consider the concentration data in Exercise 15-76. Use σ = 8 and assume that the desired process target is 100.
(a) Construct an EWMA control chart with λ = 0.2. Does the process appear to be in control?
(b) Construct an EWMA control chart with λ = 0.5. Compare your results to part (a).
(c) If the concentration shifted to 104, would you prefer the chart in part (a) or (b)? Explain.
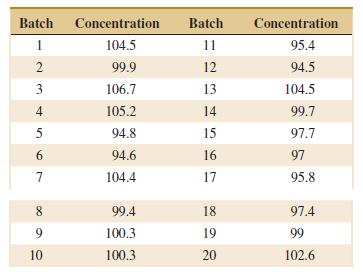
Exercise 15-76
The concentration of a chemical product is measured by taking four samples from each batch of material. The average concentration of these measurements for the last 20 batches is shown in the following table:
Fantastic news! We've Found the answer you've been seeking!
Step by Step Answer:
a The process appears to be in control b The process appear...View the full answer

Answered By
Madhvendra Pandey
Hi! I am Madhvendra, and I am your new friend ready to help you in the field of business, accounting, and finance. I am a College graduate in B.Com, and currently pursuing a Chartered Accountancy course (i.e equivalent to CPA in the USA). I have around 3 years of experience in the field of Financial Accounts, finance and, business studies, thereby looking forward to sharing those experiences in such a way that finds suitable solutions to your query.
Thus, please feel free to contact me regarding the same.
1+ Reviews
10+ Question Solved
Related Book For 

Applied Statistics And Probability For Engineers
ISBN: 9781118539712
6th Edition
Authors: Douglas C. Montgomery, George C. Runger
Question Posted:
