

Repeat Example 9.11, but this time use the Excel function INTERCEPT() and SLOPE() to calculate these values
Question:
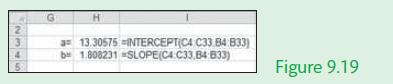
Repeat Example 9.11, but this time use the Excel function INTERCEPT() and SLOPE() to calculate these values in Cells H3 and H4. Figure 9.19 illustrates the change to cells H3 and H4 in the Excel solution given in Figure 9.17
Data from Example 9.11
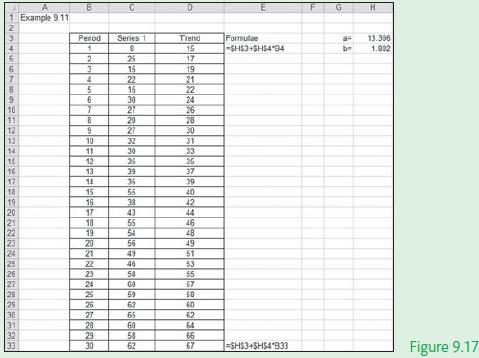
In this example we will fit a trend line to a time series data set given the value of the slope of the trend line and its intercept. Figure 9.17 illustrates the manual calculation of the trend line using basic Excel formulae.
Fantastic news! We've Found the answer you've been seeking!
Step by Step Answer:
Excel solution Period Cells B4B...View the full answer

Answered By
Muhammad Ghyas Asif
It is my obligation to present efficient services to my clients by providing a work of quality, unique, competent and relevant. I hope you have confidence in me and assign me the order and i promise to follow all the instructions and keep time.
109+ Reviews
203+ Question Solved
Related Book For 

Question Posted:
