In this example we will fit a trend line to a time series data set given the
Question:
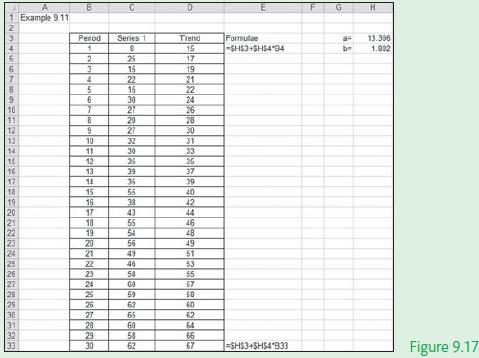
In this example we will fit a trend line to a time series data set given the value of the slope of the trend line and its intercept. Figure 9.17 illustrates the manual calculation of the trend line using basic Excel formulae.
Transcribed Image Text:
1 Example 911 2 3 7 8 9 10 11 12 13 14 16 16 17 18 19 20 21 22 23 24 25 26 27 28 29 30 31 32 33 Perod 1 2 3 4 5 6 7 8 9 10 11 12 13 14 15 16 17 18 19 20 21 NATHENSAR Series 1 8 25 15 22 15 30 27 20 27 32 30 36 39 35 55 38 43 55 54 56 49 46 58 60 59 62 65 60 58 62 la Trend 16 17 19 21 22 24 26 28 30 31 33 35 37 39 40 42 44 46 48 49 51 53 55 57 58 60 62 64 66 67 Formulae -SH$3+5H54*34 -SH$3+SH54 B33 F 165 br 13.306 1.802 Figure 9.17
Fantastic news! We've Found the answer you've been seeking!
Step by Step Answer:
Answer rating: 100% (1 review)
Figure 917 indicates that we have put the value of the intercept in the cell ...View the full answer
Answered By
Utsab mitra
I have the expertise to deliver these subjects to college and higher-level students. The services would involve only solving assignments, homework help, and others.
I have experience in delivering these subjects for the last 6 years on a freelancing basis in different companies around the globe. I am CMA certified and CGMA UK. I have professional experience of 18 years in the industry involved in the manufacturing company and IT implementation experience of over 12 years.
I have delivered this help to students effortlessly, which is essential to give the students a good grade in their studies.
3.50+
2+ Reviews
10+ Question Solved
Related Book For
Question Posted:
Students also viewed these Business questions
-
Repeat Example 9.11, but this time use the Excel function INTERCEPT() and SLOPE() to calculate these values in Cells H3 and H4. Figure 9.19 illustrates the change to cells H3 and H4 in the Excel...
-
Use the Excel TREND() function to fit a trend line to the Example 8.1 data set, as illustrated in Figure 8.20. Data from Example 8.1 A large manufacturing firm with some 8000 employees has designed a...
-
In this example we will show how to use all the formulae listed in this chapter and we will demonstrate how to use the Data Analysis > Exponential Smoothing to undertake the analysis. Figures 9.40...
-
A department store is being planned for a new shopping mall. Using the information in Table 4.8, assign departments to locations in order to minimize traffic flow through the store. TABLE 4.8...
-
The company has outstanding bonds payable with a total face value of $100,000. On July 1, the company redeemed the bonds by purchasing them on the open market for a total of $102,700. Make the...
-
Given the data flow diagram shown in Figure and using transform analysis, develop a structurechart. 3.7 Updated student schedule Display updated schedule Student Message 3.6 Display Coursel/section...
-
An engineer prepares a report to evaluate a project using PW and IRR. Just before submitting the report, he spills coffee on it, making the first digit of the 2-digit IRR unreadable. The second digit...
-
The following were selected from among the transactions completed during the current year by Danix Co., an appliance wholesale company: Jan. 21. Sold merchandise on account to Black Tie Co., $28,000....
-
What are the meanings of the following 1.Data definition language 2.Data manipulation language 3.Data integrity language 4.Data control language
-
Take the first differences between the observations in the time series from X9.1. Would you say that the differenced time series is stationary? If it is not what would you do to make it stationary?...
-
Go to one of the websites that allow you to download financial time series (e.g. http://finance.yahoo.com/) and plot the series of your choice in several identical line graphs. Change the scale of...
-
What ethical issues might arise during the fact-finding process, and how should they be handled?
-
The following financial statement information is from five separate companies. Company A Company B Company C Company D Company E December 31, 2018 Assets $ 44,000 $ 34,320 $ 28,160 $ 78,320 $ 120,120...
-
2. Please respond to the following questions in a minimum of 250 words: a. Illustrate the transactional model. You may note that meanings exist among people (e.g., difference between "quitting" and...
-
Higher Order Thinking At the state fair, a person must be at least 138 centimeters tall to ride the roller coaster. Chiko wants to ride the coaster. He is 4 feet 7 inches tall. Is Chiko tall enough...
-
I. Determine the par yield rates (yields to maturity on par bonds) and forward rates (the ones with ? below) based on the spot curve given below. Make sure that you show your work, not just the...
-
Homeland Security Threat Analysis Free societies are at risk for terrorist acts for several reasons: a) loose control of public information; b) weapons, communications equipment, and explosives are...
-
Global Air Inc. recently hired a new accountant with limited real-world experience in corporate accounting. Prior to starting the new job, the accountant was very busy and was unable to review any...
-
As economic conditions change, how do banks adjust their asset portfolio?
-
Annual maintenance costs for a particular section of highway pavement are $2000. The placement of a new surface would reduce the almual maintenance cost to $500 per year for the first 5 years and to...
-
An investor is considering buying a 20-year corporate bond. The bond has a face value of $1000 and pays 6% interest per year in two semiannual payments. Thus the purchaser of the bond will receive...
-
A road building contractor has received a major highway construction contract that will require 50,000 m3 of crushed stone each year for 5 years. The needed stone can be obtained from a quarry for...
-
Why can't farmers save their agricultural profits to buy better inputs for higher yields next cropping season? ( Explain
-
Write a global issue report on illiterate rate in catin erope Describe two problem arusing due to illiterate rate in latin europe. (Researen must be daked between 2021-2023) included APA reference....
-
Draw a clearly labelled D and S diagram showing S shifting right and D shifting right. Q will increase; P is ambiguous.
Study smarter with the SolutionInn App