

The graph shows the money remaining in the Medicare Trust Fund at the end of the fiscal
Question:
The graph shows the money remaining in the Medicare Trust Fund at the end of the fiscal year.
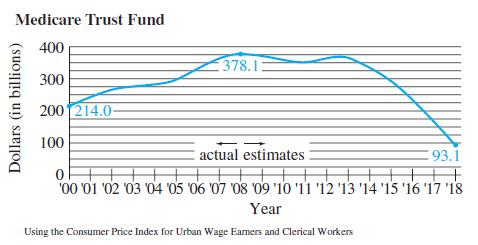
Find the approximate average rate of change in the trust fund for each time period.
a. From 2000 to 2008 (the peak)
b. From 2008 to 2018
Fantastic news! We've Found the answer you've been seeking!
Step by Step Answer:
From the given graph we can see that a the approximate a...View the full answer

Answered By
Gloria Joseph
Hi,
I am a tutor in Mathematics subject. I love learning and teaching too. I understand that each student is unique and hence I need to change myself - while communicating with each one of the students - so as to make the activity of learning a play thing, once and then for ever!
I believe in activity-based learning, with the help of tools/games/students participating in events- especially outdoor ones. I also believe in continuous learning and teaching to keep myself up to date!
Cheers!!
0 Reviews
10+ Question Solved
Related Book For 

Calculus With Applications
ISBN: 9780321831101
10th Edition
Authors: Margaret L Lial, Raymond N Greenwell, Nathan P Ritchey
Question Posted:
