

The graph shows the population in millions of bacteria t minutes after an antibiotic is introduced into
Question:
The graph shows the population in millions of bacteria t minutes after an antibiotic is introduced into a culture. Find and interpret the average rate of change of population with respect to time for the following time intervals.
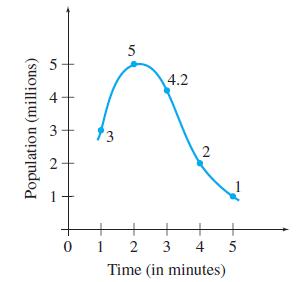
a. 1 to 2
b. 2 to 3
c. 3 to 4
d. 4 to 5
e. How long after the antibiotic was introduced did the population begin to decrease?
f. At what time did the rate of decrease of the population slow down?
Fantastic news! We've Found the answer you've been seeking!
Step by Step Answer:
To find the average rate of change of population with respect to time for each time interval you can ...View the full answer

Answered By
Deepak Sharma
0 Reviews
10+ Question Solved
Related Book For 

Calculus With Applications
ISBN: 9780321831101
10th Edition
Authors: Margaret L Lial, Raymond N Greenwell, Nathan P Ritchey
Question Posted:
