Question:
For Table 4.3, Table 4.7 shows SAS output for a Poisson loglinear model fit using X = weight and Y = number of satellites.
a. Estimate E(Y) for female crabs of average weight, 2.44 kg.
b. Use β̂ to describe the weight effect. Show how to construct the reported confidence interval.
c. Construct a Wald test that Y is independent of X. Interpret.
d. Can you conduct a likelihood-ratio test of this hypothesis? If not, what else do you need?
e. Is there evidence of overdispersion? If necessary, adjust standard errors and interpret.
Table 4.3:
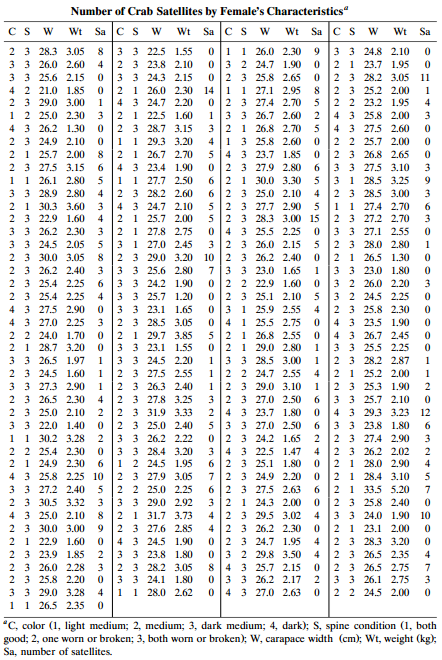
Table 4.7:
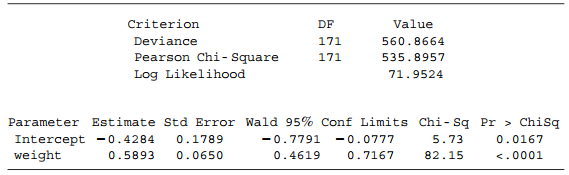
Transcribed Image Text:
Number of Crab Satellites by Female's Characteristics" Sa Cs w Wt Sa CS w Sa CS W Sa Wt Wt Wt 2 3 28.3 3.05 8 3 3 22.5 1.55 3 3 26.0 2.60 3 3 25.6 2.15 4 2 21.0 1.85 2 3 29.0 3.00 1 2 25.0 2.30 4 3 26.2 1.30 2 3 24.9 2.10 2 1 25.7 2.00 2 3 27.5 3.15 1 1 26.1 2.80 3 3 28.9 2.80 2 1 30.3 3.60 2 3 22.9 1.60 3 3 26.2 2.30 3 3 24.5 2.05 2 3 30.0 3.05 2 3 26.2 2.40 2 3 25.4 2.25 2 3 25.4 2.25 4 3 27.5 2.90 01 1 26.0 2.30 03 2 24.7 1.90 02 3 25.8 2.65 2 1 26.0 2.30 14 1 1 27.1 2.95 0 |2 3 27.4 2.70 3 3 26.7 2.60 3 2 1 26.8 2.70 4 |1 3 25.8 2.60 4 3 23.7 1.85 02 3 27.9 2.80 6 2 1 30.0 3.30 6 |2 3 25.0 2.10 5 2 3 27.7 2.90 5 2 3 28.3 3.00 15 2.25 3 3 24.8 2.10 2 1 23.7 1.95 2 3 28.2 3.05 2 3 25.2 2.00 2 2 23.2 1.95 4 3 25.8 2.00 4 3 27.5 2.60 2 2 25.7 2.00 2 3 26.8 2.65 3 3 27.5 3.10 3 1 28.5 3.25 2 3 28.5 3.00 1 1 27.4 2.70 2 3 27.2 2.70 3 3 2 3 28.0 2.80 2 1 26.5 1.30 3 3 23.0 1.80 3 2 26.0 2.20 3 2 24.5 2.25 2 3 25.8 2.30 4 3 23.5 1.90 4 3 26.7 2.45 3 3 25.5 2.25 2 3 28.2 2.87 2 1 25.2 2.00 2 3 25.3 1.90 4 2 3 23.8 2.10 3 3 24.3 2.15 11 8. 4 3 24.7 2.20 2 1 22.5 1.60 2 3 28.7 3.15 1 1 29.3 3.20 2 1 26.7 2.70 4 3 23.4 1.90 1 1 27.7 2.50 2 3 28.2 2.60 4 4 4 3 24.7 2.10 6. 2 1 25.7 2.00 0 14 3 25 2.55 27.8 2.75 3 1 27.0 2.45 2 3 29.0 3.20 10 3 3 25.6 2.80 3 3 24.2 1.90 3 3 25.7 1.20 33 23.1 1.б5 2 3 28.5 3.05 2 1 29.7 3.85 3 3 23.1 1.55 3 3 24.5 2.20 2 3 27.5 2.55 2 3 26.3 2.40 2 3 27.8 3.25 2 3 31.9 3.33 2 3 25.0 2.40 3 3 26.2 2.22 3 3 28.4 3.20 1 2 24.5 1.95 2 3 27.9 3.05 2 2 25.0 2.25 3 3 29.0 2.92 2 1 31.7 3.73 2 3 27.6 2.85 4 3 24.5 1.90 3 |2 3 26.0 2.15 2 3 26.2 2.40 7|3 3 23.0 1.65 02 2 22.9 1.60 02 3 25.1 2.10 3 1 25.9 2.55 0 4 1 25.5 2.75 5 2 1 26.8 2.55 02 1 29.0 2.80 3 3 28.5 3.00 12 2 24.7 2.55 1 2 3 29.0 3.10 3 2 3 27.0 2.50 2 4 3 23.7 1.80 5 3 3 27.0 2.50 02 3 24.2 1.65 4 3 22.5 1.47 6 |2 3 25.1 1.80 72 3 24.9 2.20 6 2 3 27.5 2.63 3 |2 1 24.3 2.00 4 2 3 29.5 3.02 2 3 26.2 2.30 02 3 24.7 1.95 03 2 29.8 3.50 8 4 3 25.7 2.15 0 |3 3 26.2 2.17 0 4 3 27.0 2.63 4 4 4 3 27.0 2.25 2 2 24.0 1.70 2 1 28.7 3.20 3 3 26.5 1.97 2 3 24.5 1.60 3 3 27.3 2.90 2 3 26.5 2.30 2 3 25.0 2.10 3 3 22.0 1.40 1 1 30.2 3.28 2 2 25.4 2.30 2 1 24.9 2.30 4 3 25.8 2.25 10 3 3 27.2 2.40 2 3 30.5 3.32 4 3 25.0 2.10 4 3 3 25.7 2.10 4 3 29.3 3.23 4 6. 12 3 3 23.8 1.80 2 2 3 27.4 2.90 2 3 26.2 2.02 2 1 28.0 2.90 2 1 28.4 3.10 2 1 33.5 5.20 2 3 25.8 2.40 3 3 24.0 1.90 2 1 23.1 2.00 2 3 28.3 3.20 2 3 26.5 2.35 2 3 26.5 2.75 3 3 26.1 2.75 2 2 24.5 2.00 6. 6. 4 6. 10 2 3 30.0 3.00 2 1 22.9 1.60 2 3 23.9 1.85 2 3 26.0 2.28 2 3 25.8 2.20 3 3 29.0 3.28 4 1 1 26.5 2.35 0 4 3 3 23.8 1.80 2 3 28.2 3.05 3 3 24.1 1.80 1 1 28.0 2.62 4 "C, color (1, light medium; 2, medium; 3, dark medium; 4, dark); S, spine condition (1, both good; 2, one worn or broken; 3, both worn or broken); W, carapace width (cm); Wt, weight (kg); Sa, number of satellites. Criterion Deviance Pearson Chi- Square Log Likelihood DF 171 171 Value 560.8664 535.8957 71.9524 Parameter Estimate Std Error Wald 95% Conf Limits Chi- Sq Pr > Chisq -0.7791 0.4619 Intercept -0.4284 weight 0.1789 0.0650 -0.0777 0.7167 5.73 82.15 0.5893 0.0167 <.0001