

The following E(t) curves were obtained from a tracer test on two tubular reactors in which dispersion
Question:
The following E(t) curves were obtained from a tracer test on two tubular reactors in which dispersion is believed to occur.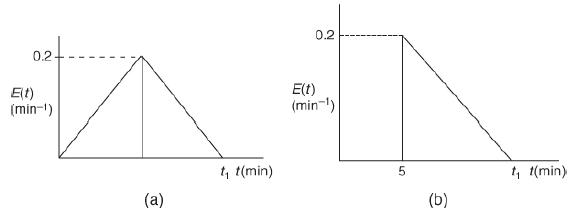
(a) RTD Reactor A; (b) RTD Reactor B The graphs for RTD reactors A and B are shown. The horizontal axis represents time (in minutes) and the vertical axis represents E of t (in minute inverse) in both graphs. The first graph is shown for RTD reactor A. The curve starts at the origin, increases linearly, reaches a maximum value of E of t at 0.2, and again gradually decreases to 0 at time interval t subscript 1. The second graph shows the response of RTD reactor B. The curve is a vertical line, where E(t) value increases from 0 to a maximum of 0.2 for the constant value 5 of t. After this, it linearly decreases and reaches 0 at t subscript 1.
a. What is the final time t1 (in minutes) for the reactor shown in Figure P16-5B (a)? How about in Figure P16-5B (b)?
b. What is the mean residence time, tm, and variance, =2, for the reactor shown in Figure P16-5B (a)? How about in Figure P16-5B (b)?
c. What is the fraction of the fluid that spends 7 minutes or longer in Figure P16-5B (a)? How about in Figure P16-5B (b)?
Step by Step Answer:
a b Mean residence time c Fracti...View the full answer


