

Examine the following plots of bivariate return distributions closely. Pay special attention to the values on the
Question:
Examine the following plots of bivariate return distributions closely. Pay special attention to the values on the axes. Both plots are joint distributions of returns of stocks. The first
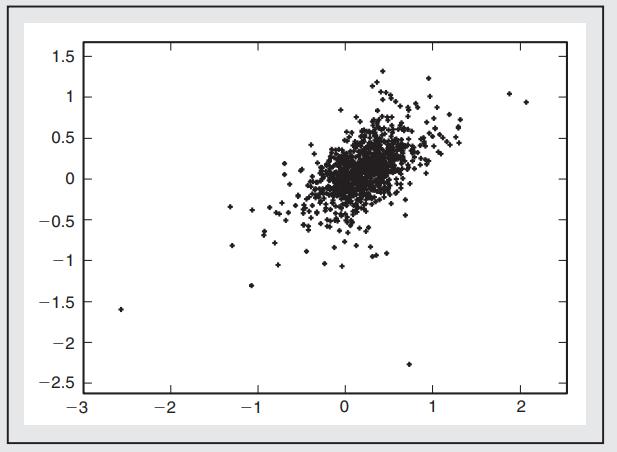
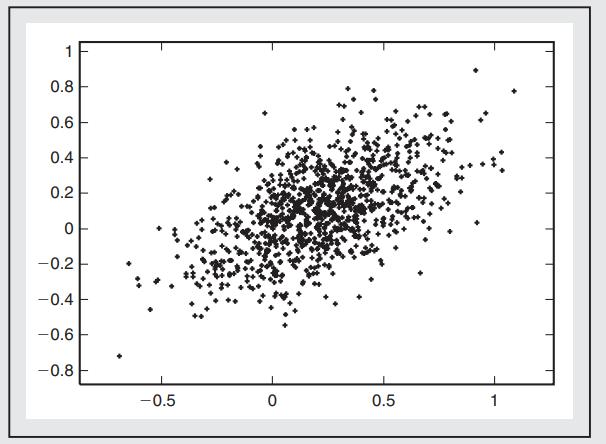
Plot is from a Student’st distribution and the second one from a normal distribution. Both have the same means and covariance matrices. Explain which joint return distribution is likely to be riskier in terms of VaR. Why are they different in risk even though the means, variances, and covariances are the same?
Fantastic news! We've Found the answer you've been seeking!
Step by Step Answer:
The first plot from the Tdistribution has fatter tails and is therefore going to res...View the full answer

Answered By
Diksha Bhasin
I have been taking online teaching classes from past 5 years, i.e.2013-2019 for students from classes 1st-10th. I also take online and home tuitions for classes 11th and 12th for subjects – Business Studies and Economics from past 3 years, i.e. from 2016-2019. I am eligible for tutoring Commerce graduates and post graduates. I am a responsible for staying in contact with my students and maintaining a high passing rate.
1+ Reviews
10+ Question Solved
Related Book For 

Question Posted:
