

The table shows the distribution of household sizes in the United States for a recent year. Find
Question:
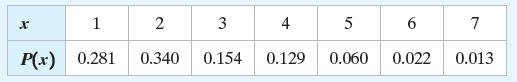
The table shows the distribution of household sizes in the United States for a recent year.
Find the
(a) mean,
(b) variance,
(c) standard deviation, and
(d) expected value of the probability distribution.
Interpret the results.
Fantastic news! We've Found the answer you've been seeking!
Step by Step Answer:
a 246 b 195 c 140 d 246 The size of ...View the full answer

Answered By
Seema kuldeep
although I don't have an experience of teaching in a particular institute, previously I was an expert on Chegg and I have used to teach my batch mates and also my juniors.
1+ Reviews
10+ Question Solved
Related Book For 

Elementary Statistics Picturing The World
ISBN: 9781292260464
7th Global Edition
Authors: Betsy Farber, Ron Larson
Question Posted:
