

Using data from Appendix 8, construct a graph to show the trend in the third ionization energies
Question:
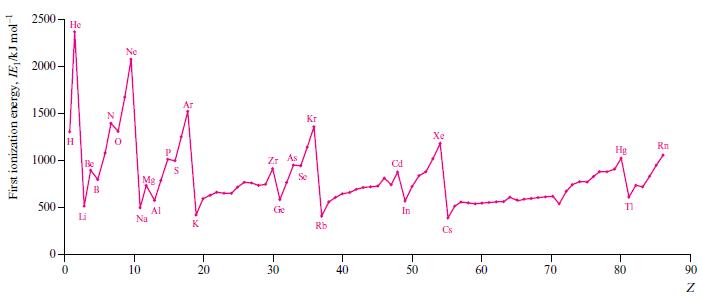
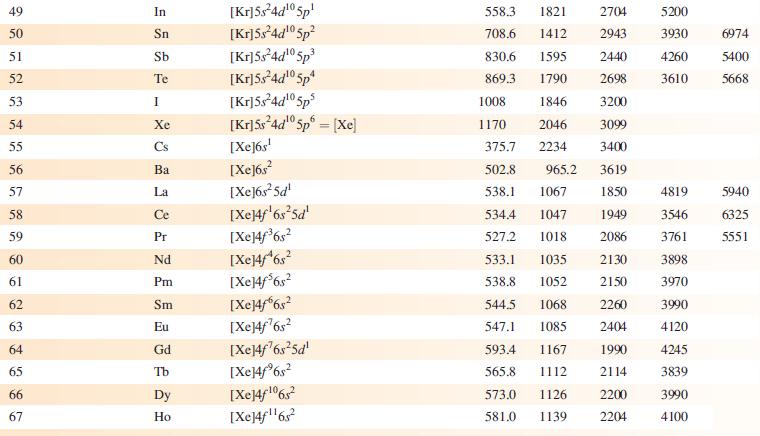
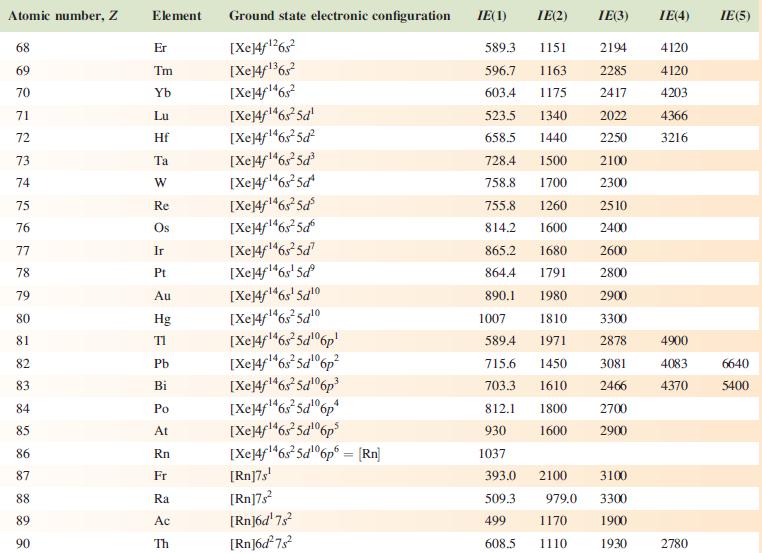
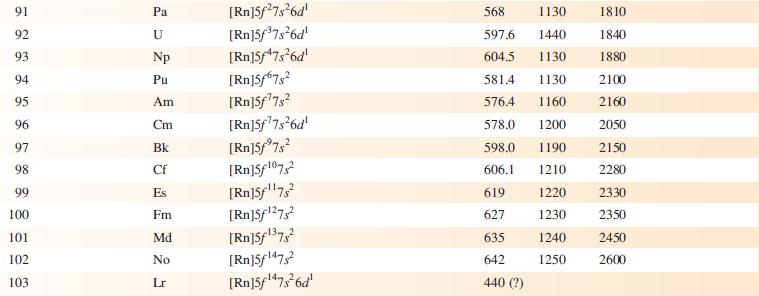
Using data from Appendix 8, construct a graph to show the trend in the third ionization energies of the elements from Li to Kr. Compare the graph with that shown in Fig. 1.16, and rationalize what you observe.
Figure 1.16
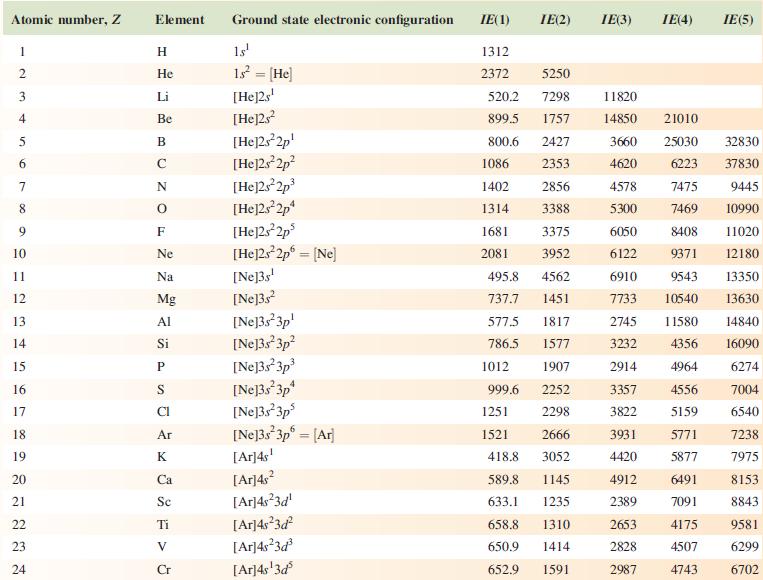
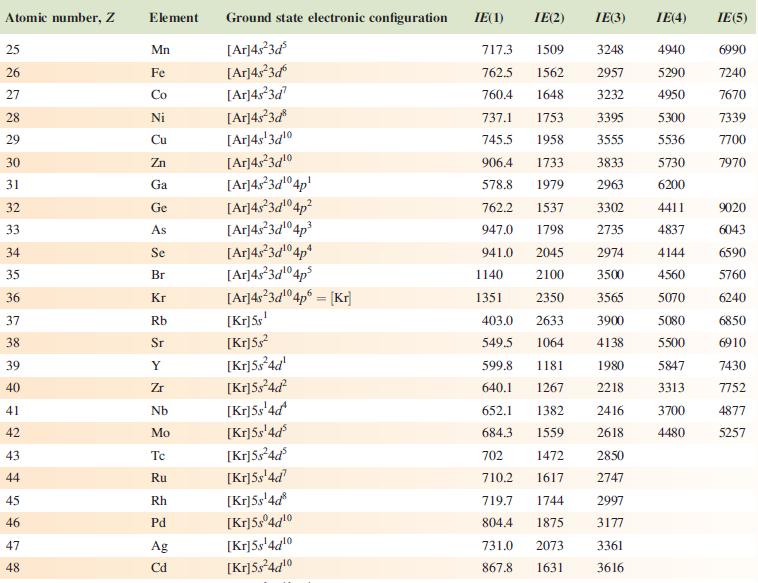
Data from Appendix 8
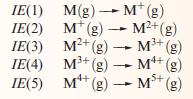
Data are given for the first five ionizations.† IE(n) in kJ mol−1 for the processes:
Fantastic news! We've Found the answer you've been seeking!
Step by Step Answer:
The amount of energy required to remove an electron from a neutral gaseous atom X in order to form a ...View the full answer

Answered By
Muhammad Umair
I have done job as Embedded System Engineer for just four months but after it i have decided to open my own lab and to work on projects that i can launch my own product in market. I work on different softwares like Proteus, Mikroc to program Embedded Systems. My basic work is on Embedded Systems. I have skills in Autocad, Proteus, C++, C programming and i love to share these skills to other to enhance my knowledge too.
1+ Reviews
10+ Question Solved
Related Book For 

Question Posted:
