

The graph here reflects taxable income, accounting income, and deferred tax for Sima Corporation, a private company
Question:
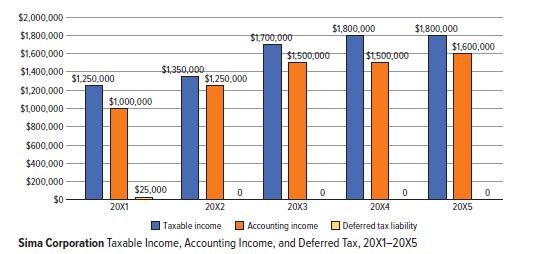
The graph here reflects taxable income, accounting income, and deferred tax for Sima Corporation, a private company that adopts ASPE for financial reporting purposes and has chosen to use the future income taxes method to account for income taxes. Sima has always been profitable.
Permanent differences total $200,000, $300,000, and $200,000 for 20X3, 20X4, and 20X5, respectively. In each year there are two sources of permanent differences.
Required:
1. Discuss the trend on the graph and what it indicates. What types of items may be contributing to the difference in taxable income compared to accounting income in each of the years? What might be contributing to the deferred tax balance in 20X1?
2. Assume that Sima Corporation made an accounting policy choice change in 20X2 from the future income taxes method to the taxes payable method. How does this impact your interpretation of the graph with respect to the deferred tax liability in 20X1?
Step by Step Answer:
Requirement 1 In all the years the taxable income is higher than the accounting income This indicate...View the full answer


Intermediate Accounting Volume 2
ISBN: 9781260881240
8th Edition
Authors: Thomas H. Beechy, Joan E. Conrod, Elizabeth Farrell, Ingrid McLeod-Dick, Kayla Tomulka, Romi-Lee Sevel
