

The accompanying scatterplot gives data from a random sample of 27 countries where the response variable is
Question:
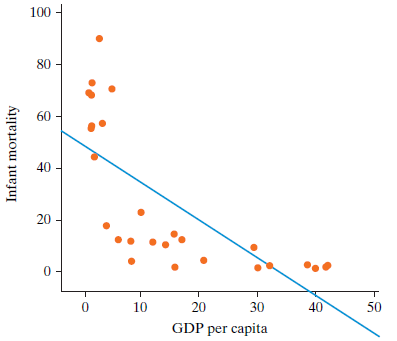
a. Describe the relationship between infant mortality and GDP per capita. Is this relationship linear?
b. Th e regression line is also included in the scatterplot. Will this regression line be a good prediction of infant mortality given GDP per capita? Why or why not? Sometimes we can transform data that don€™t fit a linear pattern in such a way that they do fit a linear pattern. We calculated the logarithm of all the values of both the infant mortality and GDP per capita and plotted the results in the scatterplot below.
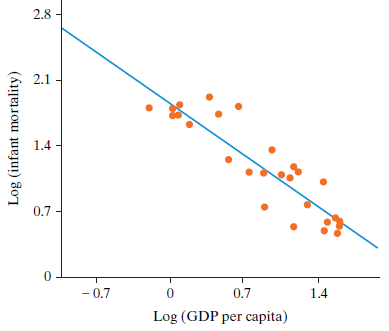
c. Describe the relationship between logarithm of infant mortality and logarithm of GDP per capita. Is this relationship linear?
d. The regression line is also included in the scatterplot. Will this regression line be a good prediction of the logarithm of infant mortality given the logarithm of GDP per capita? Why or why not?
Step by Step Answer:
a As GDP per capita increases mortality rate decreases The relationship does not appear to be linea...View the full answer


Introduction To Statistical Investigations
ISBN: 9781118172148
1st Edition
Authors: Beth L.Chance, George W.Cobb, Allan J.Rossman Nathan Tintle, Todd Swanson Soma Roy
