

The following data represent y = the number of passenger cars retired from service and x =
Question:
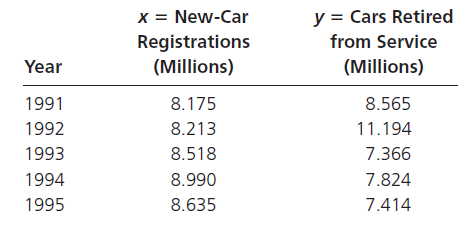
a. Determine the least-squares regression line and interpret its slope.
b. Estimate, for a year in which x = 7.0 million new passenger cars are registered, the number of cars that will be retired from service.
c. Estimate, for a year in which 9.0 million new passenger cars are registered, the number of cars that will be retired from service.
Fantastic news! We've Found the answer you've been seeking!
Step by Step Answer:
a The least squares equation and slope interpretation To facilitate pocket calculator computations t...View the full answer

Answered By
Moses mwangi
With prior writing experience, be sure that I will give a great grade, If not an A+, it will be something close to this. My reviews speaks it all, Try me!!
78+ Reviews
157+ Question Solved
Related Book For 
Question Posted:
