

A preliminary evaluation of a new process concept has produced a waste stream of the composition given
Question:
A preliminary evaluation of a new process concept has produced a waste stream of the composition given below. It is desired to reduce the waste stream to 10% of its original mass while recovering essentially pure water from the other stream. Since the solution is very dilute, we can use a simple equation known as Henry’s law to represent the system. According to Henry’s law, fiL= hixi = xiγi∞ Pisat. Use UNIFAC to estimate the Henry’s law constants when UNIFAC parameters are available. Use the Scatchard-Hildebrand theory when UNIFAC parameters are not available. Estimate the relative volatilities (relative to water) of each component. Relative volatilities are defined in problem 11.2.
Compositions in mg/liter are: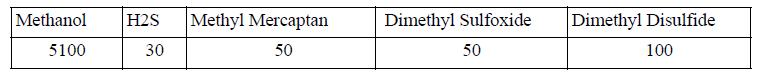
Data from problem 11.2:
In vapor-liquid equilibria the relative volatility αij is defined by Eqn. 10.32.![]()
Provide a simple proof that the relative volatility is independent of liquid and vapor composition if a system follows Raoult’s law.
In approximation to a distillation calculation for a nonideal system, calculate the relative volatility α12 and α21 as a function of composition for the n-pentane(1) ƒy acetone(2) system at 1 bar using experimental data in problem 11.11.
In approximation to a distillation calculation for a non-ideal system, calculate the relative volatility α12 and α21 as a function of composition for the data provided in problem 10.2.
Provide conclusions from your analysis.
Data from problem 11.11:
Fit the Margules two-parameter equation to the n-pentane(1) + acetone(2) system P-x-y data below at 1 bar (Lo et al. 1962. J. Chem. Eng. Data 7:32) by fitting to x1 = 0.503. Plot the resultant fit together with the original data for both phases.
Compare the data with the predictions of the MAB model.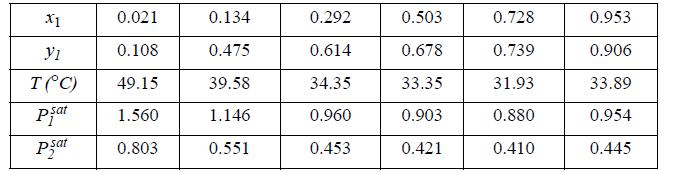
Data from problem 10.2:
Benzene and ethanol (e) form azeotropic mixtures. Prepare a y-x and a P-x-y diagram for the benzene-ethanol system at 45°C assuming the mixture is ideal. Compare the results with the experimental data tabulated below of Brown and Smith, Austral. J. Chem. 264 (1954). (P in the data table is in bar.)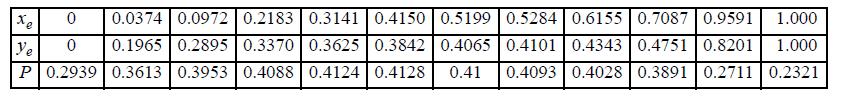
Step by Step Answer:

This question has not been answered yet.
You can Ask your question!

Introductory Chemical Engineering Thermodynamics
ISBN: 9780136068549
2nd Edition
Authors: J. Elliott, Carl Lira
