The Pxy phase diagram for a binary mixture of species 1 and 2 at 300 K is
Question:
The Pxy phase diagram for a binary mixture of species “1” and “2” at 300 K is shown in the following fi gure.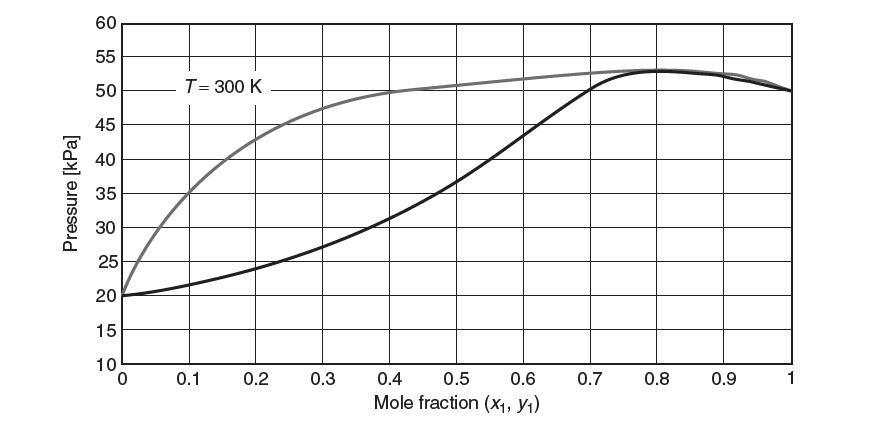
Answer the following questions:
(a) On the g raph, identify the single-phase vapor region, the single-phase liquid region, and the two-phase region.
(b) On the graph, identify the azeotrope. What is the composition of the azeotrope?
(c) Are the like or unlike interactions stronger? Explain.
(d) Estimate the value of the two-suffi x Margules parameter, A.
(e) The following scheme has been proposed to increase the purity of species 1. The feed consists of 0.4 mol/s of species 1 (F1) and 1.6 mol/s of species 2 (F2 ). Determine the values of the total fl ow rate of vapor out of Stage B, VB (mol/s), and the mole fraction of species 1 out of stage B, (y1,B).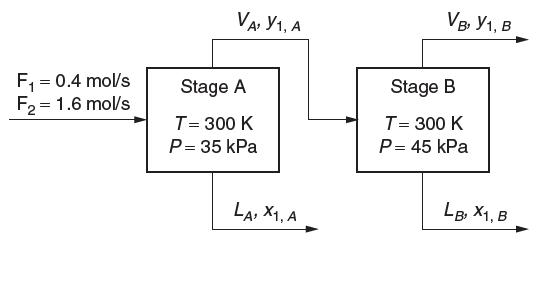
Step by Step Answer:

This question has not been answered yet.
You can Ask your question!