

The following plot shows a Pxy phase diagram for a binary mixture of species 1 and 2
Question:
The following plot shows a Pxy phase diagram for a binary mixture of species 1 and 2 at 300 K.
Answer the following: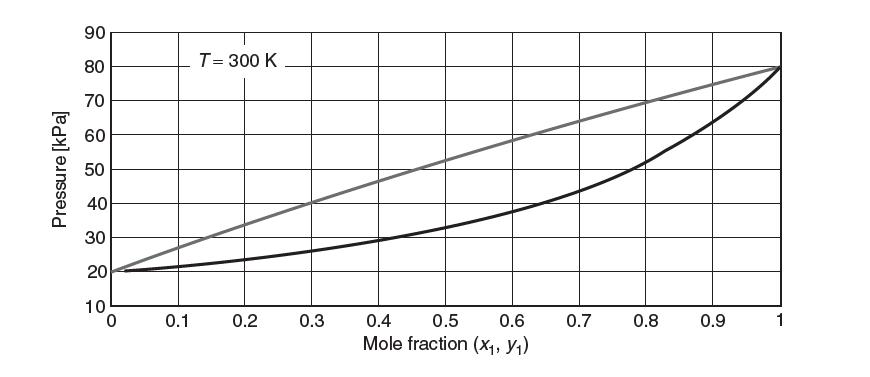
(a) A mixture of 2 mol of species 1 and 1 mol of species 2 exists at 20 kPa. Identify where it is on the plot in the preceding fi gure, and label it “A.” What phase or phases are present? What is the composition of each phase that is present?
(b) You wish to isothermally compress this mixture so that there is 1 total mol of liquid in equilibrium with 2 mol vapor. What pressure must it be compressed to? Identify where it is on the plot above and label it “B.” What is the composition of each phase present?
Step by Step Answer:

This question has not been answered yet.
You can Ask your question!
Related Book For 

Question Posted:
