The following table shows hypothetical data from 2013 to 2019 that can be used to compute the
Question:
The following table shows hypothetical data from 2013 to 2019 that can be used to compute the change in the debt-to-GDP ratio. The symbols used are as defined in the text.
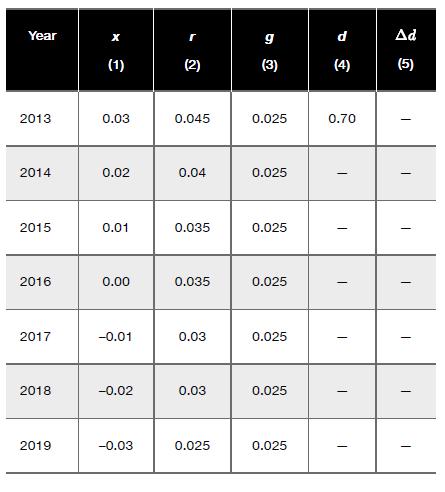
a. Remember from the text that the change in the debt-to- GDP ratio (Δd) during a year is given by

Compute (Δd) for 2013.
b. Note that d at the beginning of 2014 is equal to d at the beginning of 2013 plus (Δd) during 2013. Compute d in 2014.
c. Using the same method, compute d and (Δd) for each year, and complete columns 4 and 5.
d. Plot d in a scale diagram with the year on the horizontal axis. What discretionary variable was most responsible for the observed decline in d?
e. Note that as the primary deficit (x) falls between 2013 and 2019, there is also a downward trend in the real interest rate. Can you offer an explanation for this?
Step by Step Answer:

This question has not been answered yet.
You can Ask your question!