The table below shows government spending data over eight years in Debtland. All figures are in billions
Question:
The table below shows government spending data over eight years in Debtland. All figures are in billions of dollars. The symbols used are as defined in the text.
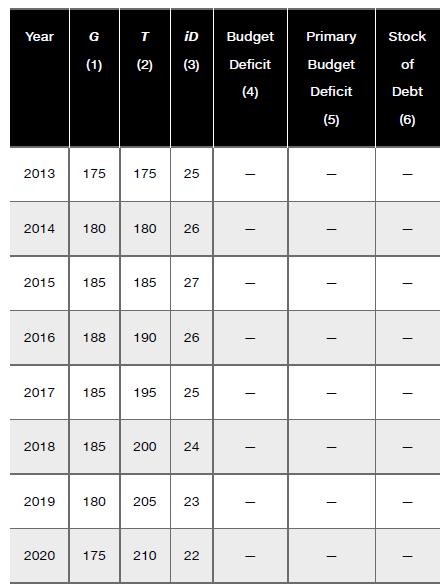
a. Compute Debtland’s budget deficit in each year and complete column 4 in the table. (Since we are computing the deficit, a negative number indicates a surplus.)
b. Compute Debtland’s primary budget deficit in each year and complete column 5 in the table.
c. Suppose the initial stock of debt (in 2012) was $400 billion. Noting that the deficit in 2013 adds to the existing stock of debt, what is the stock of debt by the end of 2013?
d. Compute the stock of debt for each year and complete column 6 in the table.
e. Suppose you know that Debtland’s debt-to-GDP ratio was the same in 2020 as in 2012. By what percentage did GDP grow between 2012 and 2020?
Step by Step Answer: