

The report Motorcycle Helmet Use in 2005Overall Results (NHTSA August 2005) included observations made on the helmet
Question:
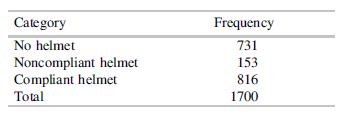
The report “Motorcycle Helmet Use in 2005—Overall Results” (NHTSA August 2005) included observations made on the helmet use of 1700 motorcyclists across the country. The data is summarized in the accompanying table. (A “noncompliant helmet” failed to meet U.S. Department of Transportation safety guidelines.)
a. What is the variable in this example? What are the possible values of that variable?
b. Construct the relative frequency distribution of this variable.
c. What proportion of observed motorcyclists wore some kind of helmet?
d. Construct an appropriate graph for this data.
Step by Step Answer:

This question has not been answered yet.
You can Ask your question!
Related Book For 

Modern Mathematical Statistics With Applications
ISBN: 9783030551551
3rd Edition
Authors: Jay L. Devore, Kenneth N. Berk, Matthew A. Carlton
Question Posted:
