

The National Center of Education Statistics conducted a survey of high school seniors, collecting test data on
Question:
The National Center of Education Statistics conducted a survey of high school seniors, collecting test data on reading, writing, and several other subjects. Here we examine a simple random sample of 200 students from this survey. Side-by-side box plots of reading and writing scores as well as a histogram of the differences in scores are shown below.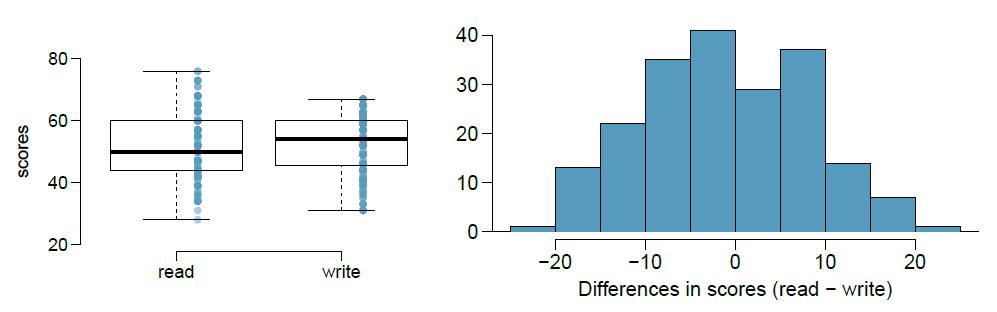
(a) Is there a clear difference in the average reading and writing scores?
(b) Are the reading and writing scores of each student independent of each other?
(c) Create hypotheses appropriate for the following research question: is there an evident difference in the average scores of students in the reading and writing exam?
(d) Check the conditions required to complete this test.
(e) The average observed difference in scores is x̄read-write = -0:545, and the standard deviation of the differences is 8.887 points. Do these data provide convincing evidence of a difference between the average scores on the two exams?
(f) What type of error might we have made? Explain what the error means in the context of the application.
(g) Based on the results of this hypothesis test, would you expect a confidence interval for the average difference between the reading and writing scores to include 0? Explain your reasoning.
Step by Step Answer:
a Based on the sidebyside box plots the average reading and writing scores do not show a large difference The medians of both distributions are close to each other as seen by the lines inside the boxe...View the full answer


OpenIntro Statistics
ISBN: 9781943450077
4th Edition
Authors: David Diez, Mine Çetinkaya-Rundel, Christopher Barr
