

Suppose there?s an appliance store that sells air conditioners. It could set its price high and sell
Question:
Suppose there?s an appliance store that sells air conditioners. It could set its price high and sell very few air conditioners, or it could set its price low and sell many more air conditioners. The following table shows some possible choices this store could make:
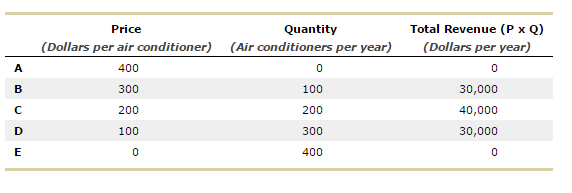
The graph below plots the firm?s total revenue curve: that is, the relationship between quantity and total revenue given by the two right columns in the table above. The five choices are also labeled. Finally, two black lines are shown; these lines are tangent to the green curve at points B and D.
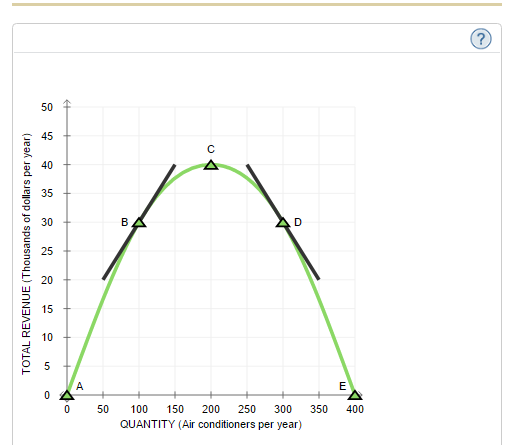
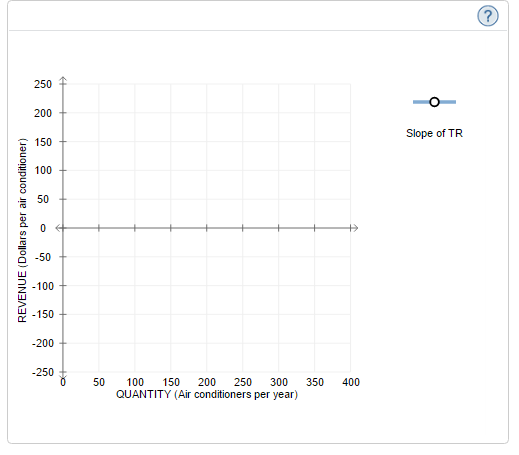
Using the information on the slope of the lines tangent to the curve at points B and D, plot the slope of the total revenue curve on the graph below. (As it turns out, it?s a straight line, so the two points you plot will determine a line.)
Required:
The total revenue curve reaches its maximum at a quantity of (400, 200, 100, 300) air conditioners per year. At this point, the slope of the total revenue curve is (negative, equal to zero, positive, at its maximum, at its minimum)?
Expert Answer:


Business Analytics Data Analysis and Decision Making
ISBN: 978-1305947542
6th edition
Authors: S. Christian Albright, Wayne L. Winston
