

Question
1. Draw an (approximate) graph to identify the feasible region using vertical andhorizontal intercepts 2. Identify the corner points of the feasible region 3. Find
1. Draw an (approximate) graph to identify the feasible region using vertical andhorizontal intercepts
2. Identify the corner points of the feasible region
3. Find the maximum value
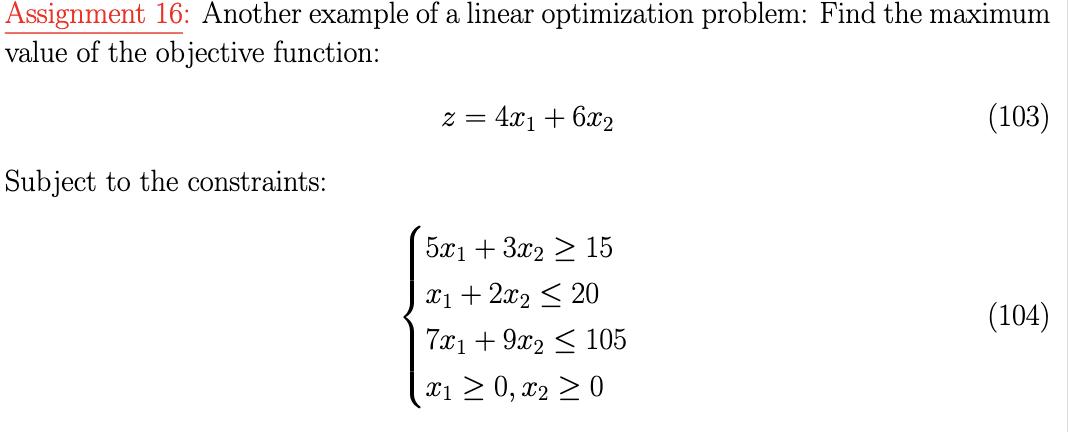
Assignment 16: Another example of a linear optimization problem: Find the maximum value of the objective function: Subject to the constraints: z = 4x1 + 6x2 5x1 + 3x2 > 15 x1 + 2x2 < 20 7x1 +9x2 105 x 0, x 0 (103) (104)
Step by Step Solution
3.41 Rating (126 Votes )
There are 3 Steps involved in it
Step: 1

Get Instant Access with AI-Powered Solutions
See step-by-step solutions with expert insights and AI powered tools for academic success
Step: 2

Step: 3
Ace Your Homework with AI
Get the answers you need in no time with our AI-driven, step-by-step assistance
Get Started
Quantitative Methods For Business
Authors: David Anderson, Dennis Sweeney, Thomas Williams, Jeffrey Cam
11th Edition
978-0324651812, 324651813, 978-0324651751