

1. Draw an (approximate) graph to identify the feasible region using vertical andhorizontal intercepts 2. Identify the...
Fantastic news! We've Found the answer you've been seeking!
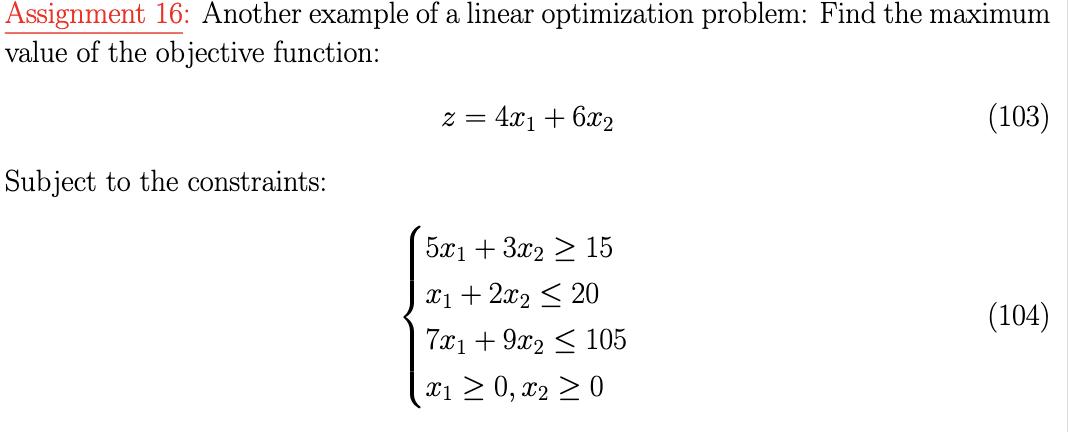
Question:
1. Draw an (approximate) graph to identify the feasible region using vertical andhorizontal intercepts
2. Identify the corner points of the feasible region
3. Find the maximum value
Expert Answer:

Related Book For 

Quantitative Methods for Business
ISBN: 978-0324651751
11th Edition
Authors: David Anderson, Dennis Sweeney, Thomas Williams, Jeffrey cam
Posted Date:
