

Cost Control. Ms. Karen Ainsworth is an employee of a well-known accounting finds management services division. She
Question:
Cost Control. Ms. Karen Ainsworth is an employee of a well-known accounting find’s management services division. She is currently on a consulting assignment to the Apex Corporation, a firm that produces corrugated paper for use in making boxes and other packing materials. Apex called in consulting help to improve its cost control program, and Ms. Ainsworth is analyzing manufacturing costs to understand more fully the important influences on these costs. She has assembled monthly data on a group of variables, and she is using regression analysis to help assess how these variables are related to total manufacturing cost. The variables Ms. Ainsworth has selected to study, the data for which are contained in the file COST4 on the CD, are
y, total manufacturing cost per month in thousands of dollars (COST)
x1, total production of paper per month in tons (PAPER)
x2, total machine hours used per month (MACHINE)
x3, total variable overhead costs per month in thousands of dollars (OVERHEAD)
x4, total direct labor hours used each month (LABOR)
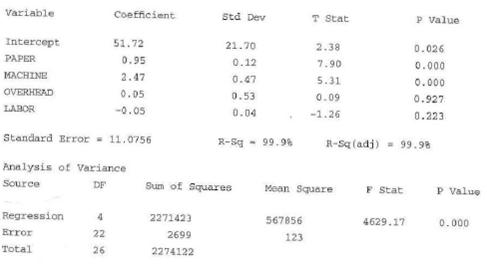
The data shown in Table 4.2 refer to the period January 2001 through March 2003. Ms. Ainsworth wants to use a cost function developed by means of regression analysis that initially includes all four of the explanatory variables. Use the regression results in Figure 4.8 to help answer the following questions:
a. What is the equation that is determined using all four explanatory variables?
b. Conduct the F test for overall fit of the regression. State the hypotheses to be tested, the decision rule, the test statistic, and your decision. Use a 5% level of significance. What conclusion can be drawn from the result of the test?
c. In the cost accounting literature, the sample regression coefficient corresponding to xk is regarded as an estimate of the true marginal cost of output associated with the variable xk. Find a point estimate of the true marginal cost associated with total machine hours per month. Also, find a 95% confidence interval estimate of the true marginal cost associated with total machine hours.
d. Test the hypothesis that the true marginal cost of output associated with total production of paper is 1.0. Use a 5% level of significance and a two- tailed test procedure. State the hypotheses to be tested, the decision rule, the test statistic, and your decision. What conclusion can be drawn from the result of the test?
e. What percentage of the variation in y has been explained by the regression?
f. What is the adjusted R2 for this regression?
g. Based on the regression equation, what actions might be taken to control costs?
Table 4.2: Data for Cost Control Exercise
COST | PAPER | MACHINE | OVERHEAD | LABOR |
1102 | 550 | 218 | 112 | 325 |
1008 | 502 | 199 | 99 | 301 |
1227 | 616 | 249 | 126 | 376 |
1395 | 701 | 277 | 143 | 419 |
1710 | 838 | 363 | 191 | 682 |
1881 | 919 | 399 | 210 | 751 |
1924 | 939 | 411 | 216 | 813 |
1246 | 622 | 248 | 124 | 371 |
1255 | 626 | 259 | 127 | 3S3 |
1314 | 659 | 266 | 135 | 402 |
1557 | 740 | 334 | 181 | 546 |
18S7 | 901 | 401 | 216 | 655 |
1204 | 610 | 238 | 117 | 351 |
1211 | 598 | 246 | 124 | 370 |
1287 | 646 | 259 | 127 | 3 87 |
1451 | 732 | 286 | 155 | 433 |
1828 | 891 | 389 | 208 | 878 |
1903 | 932 | 404 | 216 | 660 |
1997 | 964 | 430 | 233 | 694 |
1363 | 680 | 271 | 129 | 405 |
1421 | 723 | 286 | 146 | 426 |
1543 | 784 | 317 | 158 | 478 |
1774 | S41 | 376 | 199 | 601 |
1929 | 922 | 415 | 228 | 679 |
1317 | 647 | 260 | 126 | 378 |
1302 | 656 | 255 | 117 | 380 |
1388 | 704 | 281 | 142 | 429 |
Source: These data were created by Dr. Roger L. Wright, RLW Analytics. Inc., Sonoma, CA. and are used (with modification) with his permission.
FIGURE 4.8: Regression Results for Cost Control Exercise
Expert Answer:
solution Step 1 of 22 a The regression equation that is determined using all four explanatory variables is Step 2 of 22 Step 3 of 22 b The hypotheses ... View the full answer


Principles of Risk Management and Insurance
ISBN: 978-0132992916
12th edition
Authors: George E. Rejda, Michael McNamara
