

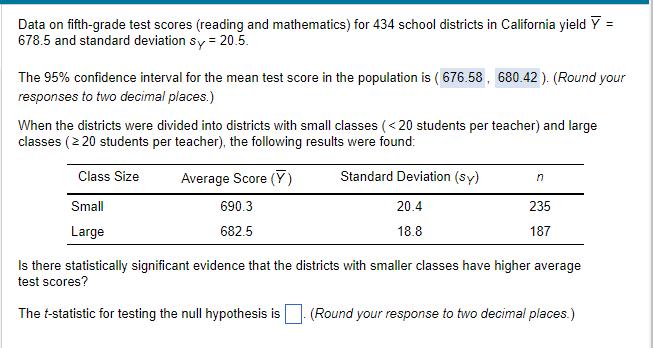
Data on fifth-grade test scores (reading and mathematics) for 434 school districts in California yield Y...
Fantastic news! We've Found the answer you've been seeking!
Question:
Expert Answer:
Okay here are the steps to solve this problem 1 The population mean test score is Y 6... View the full answer

Related Book For 
Introduction to Econometrics
ISBN: 978-0133595420
3rd edition
Authors: James H. Stock, Mark W. Watson
Posted Date:
