

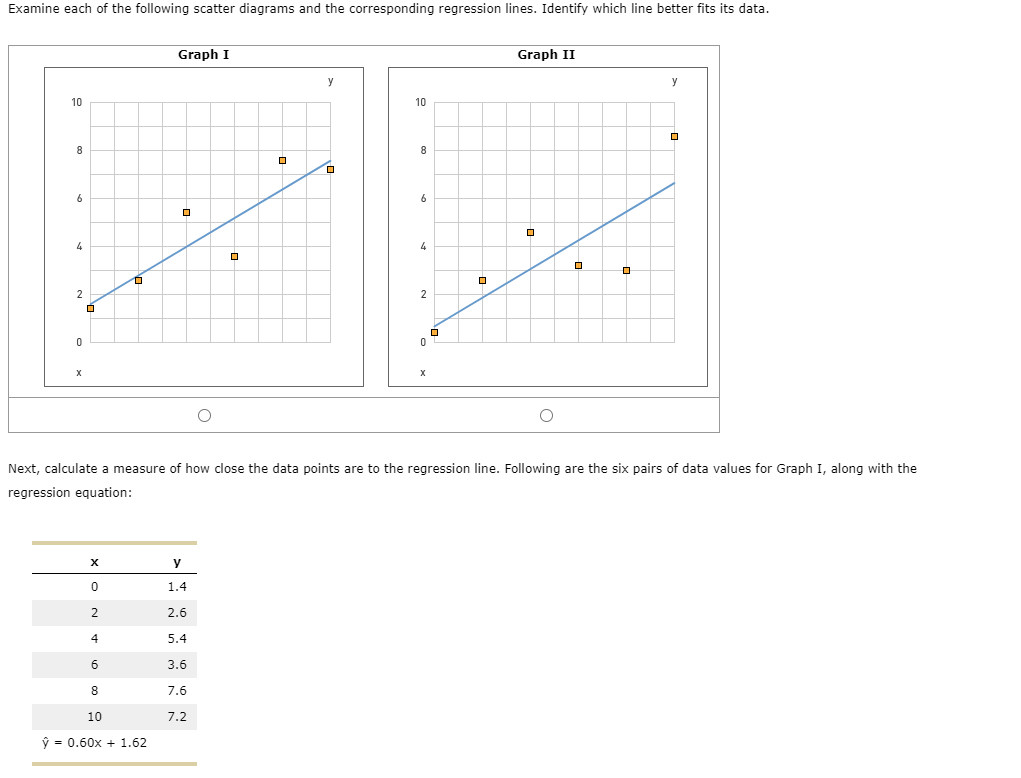
Examine each of the following scatter diagrams and the corresponding regression lines. Identify which line better...
Fantastic news! We've Found the answer you've been seeking!
Question:
Expert Answer:
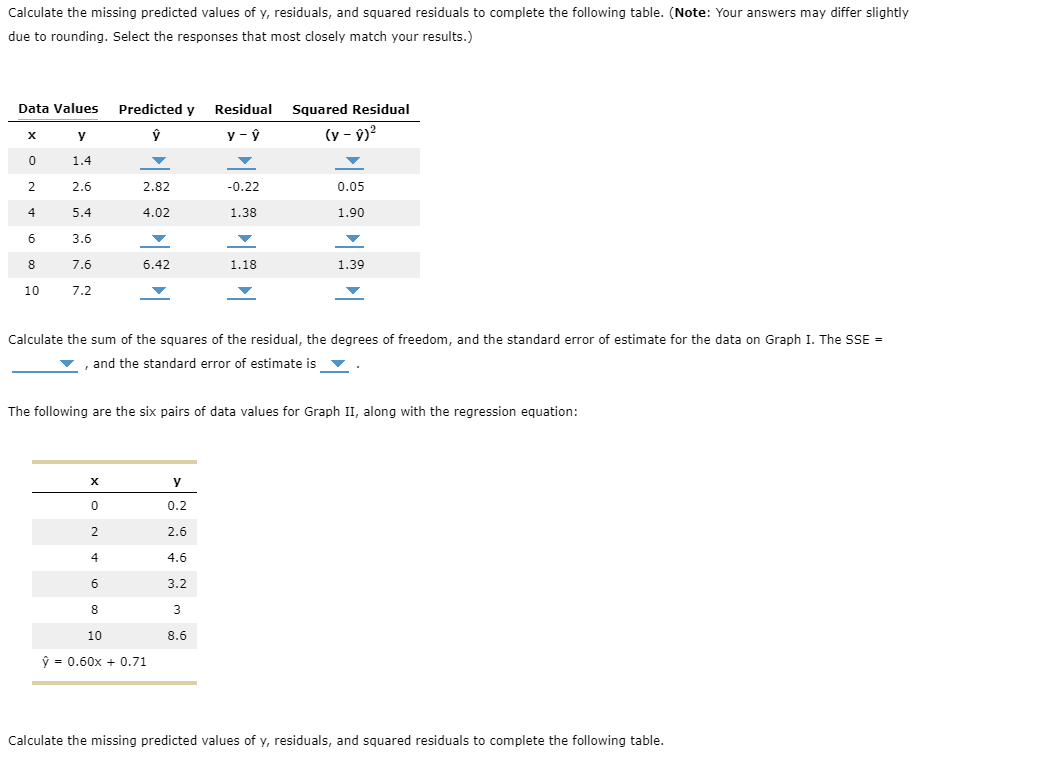
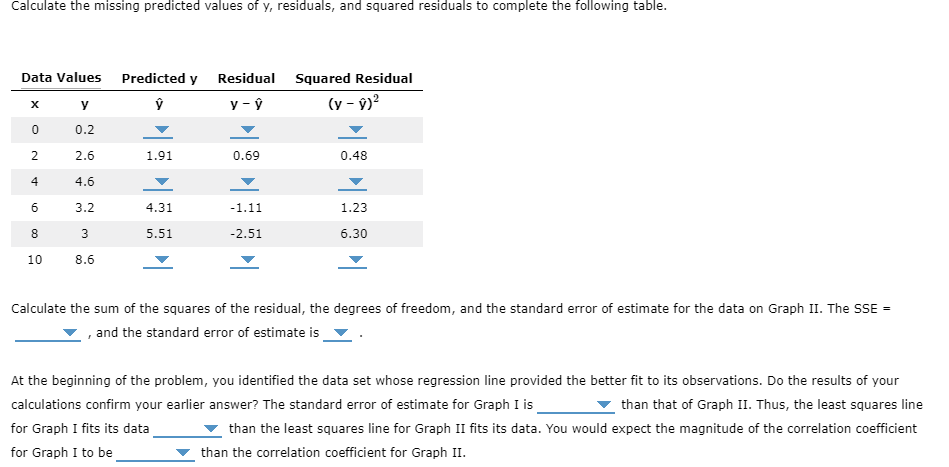
To calculate the missing predicted values of y denoted as residuals y and squared residuals y for Graph I using the regression equation 060x 162 we fo... View the full answer

Related Book For 

Income Tax Fundamentals 2013
ISBN: 9781285586618
31st Edition
Authors: Gerald E. Whittenburg, Martha Altus Buller, Steven L Gill
Posted Date:
