

First Quarter October 2014..... 150 November ........... 75 December.......... 25 Table 2 October 2014 November December....
Fantastic news! We've Found the answer you've been seeking!
Question:
Transcribed Image Text:
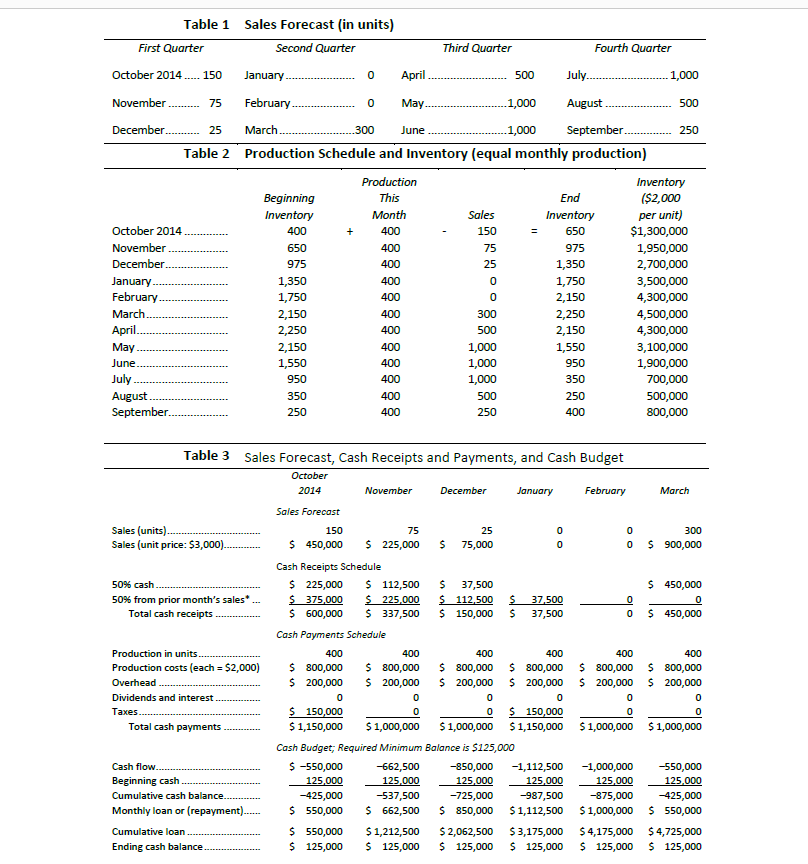
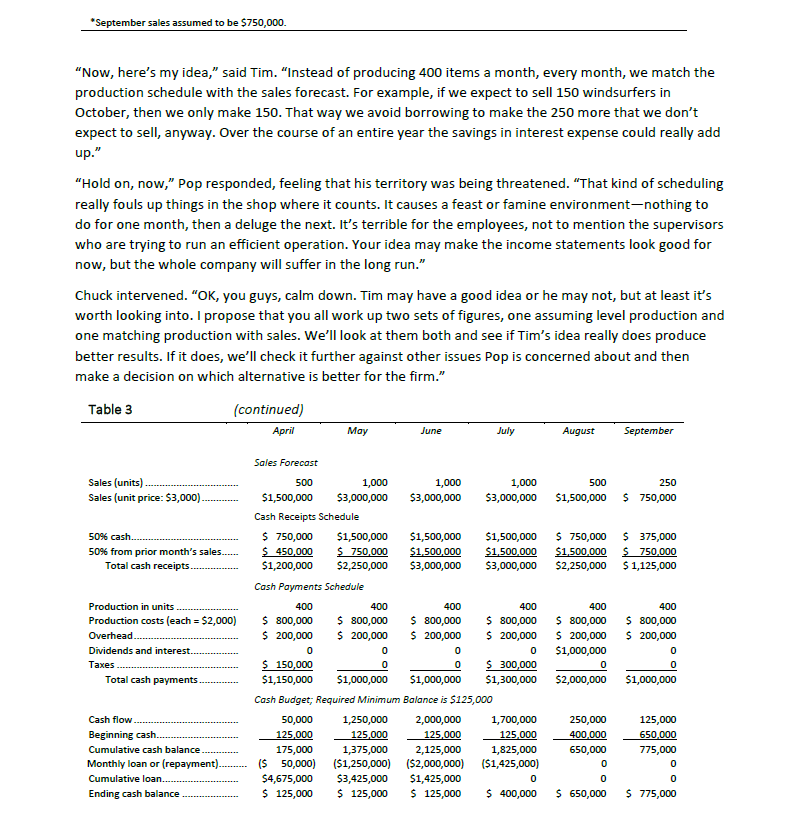
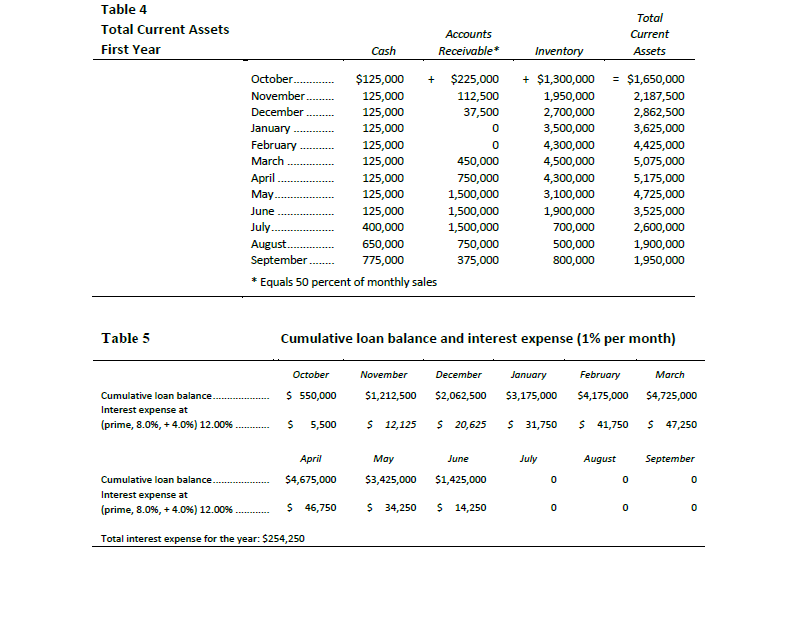
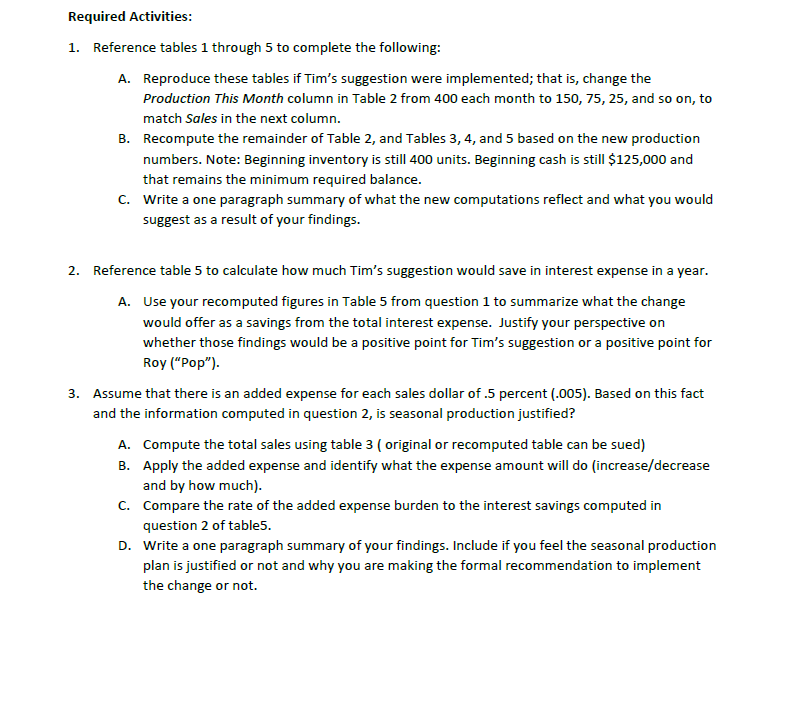
First Quarter October 2014..... 150 November ........... 75 December.......... 25 Table 2 October 2014 November December. January. February. Table 1 March April. May June. July August. September. Table 3 Sales (units). Sales (unit price: $3,000).. Sales Forecast (in units) Second Quarter Total cash payments 50% cash 50% from prior month's sales*... Total cash receipts. Production in units. Production costs (each = $2,000) Overhead Dividends and interest. Taxes. Cumulative loan Ending cash balance.. Beginning Inventory 400 January.. February 1,000 March. 1,000 September. Production Schedule and Inventory (equal monthly production) Cash flow.. Beginning cash Cumulative cash balance..... Monthly loan or (repayment)....... 650 975 1,350 1,750 2,150 2,250 2,150 1,550 950 350 250 April May 300 June 0 0 Production This Month 400 400 400 400 400 400 400 400 400 $ 550,000 $ 125,000 400 400 400 November 150 75 $ 450,000 $ 225,000 Cash Receipts Schedule $ 225,000 $ 112,500 $ 375,000 $ 225,000 $ 600,000 $ 337,500 Cash Payments Schedule 400 $ 800,000 $ 200,000 0 $ 150,000 $ 1,150,000 $ 1,000,000 400 $ 800,000 $ 200,000 0 0 Third Quarter -662,500 125,000 Sales Forecast, Cash Receipts and Payments, and Cash Budget October 2014 Sales Forecast -537,500 $ 662,500 Sales 150 $ 1,212,500 $ 125,000 75 25 0 0 300 500 1,000 1,000 1,000 500 250 December 25 $ 75,000 400 $ 800,000 $ 200,000 500 $ 37,500 $ 112,500 $ $ 150,000 Cash Budget; Required Minimum Balance is $125,000 $ -550,000 125,000 -425,000 $ 550,000 0 0 = -725,000 $ 850,000 400 $ 800,000 $ 200,000 0 $ 150,000 $ 1,000,000 $ 1,150,000 $ 2,062,500 $ 125,000 January End Inventory 975 1,350 1,750 2,150 2,250 2,150 1,550 950 350 37,500 $ 37,500 July.... August Fourth Quarter 250 400 $ 3,175,000 $ 125,000 February 0 0 o lo $1,300,000 1,950,000 2,700,000 400 $ 800,000 $ 200,000 -850,000 -1,112,500 125,000 125,000 -987,500 -875,000 $1,112,500 $1,000,000 0 0 $ 1,000,000 1,000 500 -1,000,000 125,000 250 $ 450,000 0 0 $ 450,000 Inventory ($2,000 per unit) 3,500,000 4,300,000 4,500,000 4,300,000 3,100,000 1,900,000 700,000 500,000 800,000 March 300 $ 900,000 400 $ 800,000 $ 200,000 0 0 $ 1,000,000 -550,000 125,000 -425,000 $ 550,000 $4,725,000 $4,175,000 $ 125,000 $ 125,000 *September sales assumed to be $750,000. "Now, here's my idea," said Tim. "Instead of producing 400 items a month, every month, we match the production schedule with the sales forecast. For example, if we expect to sell 150 windsurfers in October, then we only make 150. That way we avoid borrowing to make the 250 more that we don't expect to sell, anyway. Over the course of an entire year the savings in interest expense could really add up." "Hold on, now," Pop responded, feeling that his territory was being threatened. "That kind of scheduling really fouls up things in the shop where it counts. It causes a feast or famine environment-nothing to do for one month, then a deluge the next. It's terrible for the employees, not to mention the supervisors who are trying to run an efficient operation. Your idea may make the income statements look good for now, but the whole company will suffer in the long run." Chuck intervened. "OK, you guys, calm down. Tim may have a good idea or he may not, but at least it's worth looking into. I propose that you all work up two sets of figures, one assuming level production and one matching production with sales. We'll look at them both and see if Tim's idea really does produce better results. If it does, we'll check it further against other issues Pop is concerned about and then make a decision on which alternative is better for the firm." Table 3 Sales (units) Sales (unit price: $3,000). 50% cash.. 50% from prior month's sales....... Total cash receipts.. (continued) April Production in units Production costs (each = $2,000) Overhead.. Dividends and interest. Taxes Total cash payments. Cash flow. Beginning cash. Cumulative cash balance. Monthly loan or (repayment). Cumulative loan... Ending cash balance May $4,675,000 $ 125,000 Sales Forecast 500 $1,500,000 Cash Receipts Schedule $ 750,000 $1,500,000 $ 450,000 $1,200,000 Cash Payments Schedule 400 $ 800,000 $ 200,000 0 $ 150,000 $1,150,000 $1,000,000 $1,000,000 Cash Budget; Required Minimum Balance is $125,000 50,000 1,250,000 2,000,000 1,700,000 125,000 125,000 125,000 125,000 1,375,000 175,000 2,125,000 1,825,000 ($ 50,000) ($1,250,000) ($2,000,000) ($1,425,000) $3,425,000 $1,425,000 0 $ 125,000 $ 125,000 $ 400,000 1,000 $3,000,000 June 400 $ 800,000 $ 200,000 $1,500,000 $ 750,000 $1,500,000 $2,250,000 $3,000,000 0 0 1,000 $3,000,000 400 $ 800,000 $ 200,000 July 0 0 1,000 $3,000,000 August 400 $ 800,000 $ 200,000 0 $ 300,000 $1,300,000 500 250 $1,500,000 $ 750,000 $1,500,000 $ 750,000 $1,500,000 $1,500,000 $3,000,000 $2,250,000 400 $ 800,000 $ 200,000 $1,000,000 $2,000,000 0 250,000 400,000 650,000 September 0 0 $ 650,000 $ 375,000 $ 750,000 $ 1,125,000 400 $ 800,000 $ 200,000 $1,000,000 125,000 650,000 775,000 0 0 $ 775,000 Table 4 Total Current Assets First Year Table 5 Cumulative loan balance... Interest expense at (prime, 8.0%, +4.0%) 12.00% October.. November December January February March 125,000 125,000 125,000 125,000 125,000 125,000 125,000 125,000 400,000 August.. 650,000 September. 775,000 * Equals 50 percent of monthly sales April May June July.. April $4,675,000 Cumulative loan balance... Interest expense at (prime, 8.0%, +4.0%) 12.00%. Total interest expense for the year: $254,250 Accounts Receivable* $ 46,750 Cash $125,000 + $225,000 + $1,300,000 = $1,650,000 112,500 1,950,000 37,500 2,700,000 3,500,000 4,300,000 4,500,000 $ 12,125 0 0 450,000 750,000 1,500,000 1,500,000 1,500,000 750,000 375,000 May $3,425,000 June $1,425,000 $ 34,250 $ 14,250 Inventory 4,300,000 3,100,000 Cumulative loan balance and interest expense (1% per month) October $ 550,000 November December $1,212,500 $2,062,500 February $4,175,000 March $4,725,000 $ 5,500 $ 20,625 $ 41,750 $ 47,250 1,900,000 700,000 500,000 800,000 January $3,175,000 July $ 31,750 0 0 August Total Current Assets 0 0 2,187,500 2,862,500 3,625,000 4,425,000 5,075,000 5,175,000 4,725,000 3,525,000 2,600,000 1,900,000 1,950,000 September 0 0 Required Activities: 1. Reference tables 1 through 5 to complete the following: A. Reproduce these tables if Tim's suggestion were implemented; that is, change the Production This Month column in Table 2 from 400 each month to 150, 75, 25, and so on, to match Sales in the next column. B. Recompute the remainder of Table 2, and Tables 3, 4, and 5 based on the new production numbers. Note: Beginning inventory is still 400 units. Beginning cash is still $125,000 and that remains the minimum required balance. C. Write a one paragraph summary of what the new computations reflect and what you would suggest as a result of your findings. 2. Reference table 5 to calculate how much Tim's suggestion would save in interest expense in a year. A. Use your recomputed figures in Table 5 from question 1 to summarize what the change would offer as a savings from the total interest expense. Justify your perspective on whether those findings would be a positive point for Tim's suggestion or a positive point for Roy ("Pop"). 3. Assume that there is an added expense for each sales dollar of .5 percent (.005). Based on this fact and the information computed in question 2, is seasonal production justified? A. Compute the total sales using table 3 (original or recomputed table can be sued) B. Apply the added expense and identify what the expense amount will do (increase/decrease and by how much). C. Compare the rate of the added expense burden to the interest savings computed in question 2 of table5. D. Write a one paragraph summary of your findings. Include if you feel the seasonal production plan is justified or not and why you are making the formal recommendation to implement the change or not. First Quarter October 2014..... 150 November ........... 75 December.......... 25 Table 2 October 2014 November December. January. February. Table 1 March April. May June. July August. September. Table 3 Sales (units). Sales (unit price: $3,000).. Sales Forecast (in units) Second Quarter Total cash payments 50% cash 50% from prior month's sales*... Total cash receipts. Production in units. Production costs (each = $2,000) Overhead Dividends and interest. Taxes. Cumulative loan Ending cash balance.. Beginning Inventory 400 January.. February 1,000 March. 1,000 September. Production Schedule and Inventory (equal monthly production) Cash flow.. Beginning cash Cumulative cash balance..... Monthly loan or (repayment)....... 650 975 1,350 1,750 2,150 2,250 2,150 1,550 950 350 250 April May 300 June 0 0 Production This Month 400 400 400 400 400 400 400 400 400 $ 550,000 $ 125,000 400 400 400 November 150 75 $ 450,000 $ 225,000 Cash Receipts Schedule $ 225,000 $ 112,500 $ 375,000 $ 225,000 $ 600,000 $ 337,500 Cash Payments Schedule 400 $ 800,000 $ 200,000 0 $ 150,000 $ 1,150,000 $ 1,000,000 400 $ 800,000 $ 200,000 0 0 Third Quarter -662,500 125,000 Sales Forecast, Cash Receipts and Payments, and Cash Budget October 2014 Sales Forecast -537,500 $ 662,500 Sales 150 $ 1,212,500 $ 125,000 75 25 0 0 300 500 1,000 1,000 1,000 500 250 December 25 $ 75,000 400 $ 800,000 $ 200,000 500 $ 37,500 $ 112,500 $ $ 150,000 Cash Budget; Required Minimum Balance is $125,000 $ -550,000 125,000 -425,000 $ 550,000 0 0 = -725,000 $ 850,000 400 $ 800,000 $ 200,000 0 $ 150,000 $ 1,000,000 $ 1,150,000 $ 2,062,500 $ 125,000 January End Inventory 975 1,350 1,750 2,150 2,250 2,150 1,550 950 350 37,500 $ 37,500 July.... August Fourth Quarter 250 400 $ 3,175,000 $ 125,000 February 0 0 o lo $1,300,000 1,950,000 2,700,000 400 $ 800,000 $ 200,000 -850,000 -1,112,500 125,000 125,000 -987,500 -875,000 $1,112,500 $1,000,000 0 0 $ 1,000,000 1,000 500 -1,000,000 125,000 250 $ 450,000 0 0 $ 450,000 Inventory ($2,000 per unit) 3,500,000 4,300,000 4,500,000 4,300,000 3,100,000 1,900,000 700,000 500,000 800,000 March 300 $ 900,000 400 $ 800,000 $ 200,000 0 0 $ 1,000,000 -550,000 125,000 -425,000 $ 550,000 $4,725,000 $4,175,000 $ 125,000 $ 125,000 *September sales assumed to be $750,000. "Now, here's my idea," said Tim. "Instead of producing 400 items a month, every month, we match the production schedule with the sales forecast. For example, if we expect to sell 150 windsurfers in October, then we only make 150. That way we avoid borrowing to make the 250 more that we don't expect to sell, anyway. Over the course of an entire year the savings in interest expense could really add up." "Hold on, now," Pop responded, feeling that his territory was being threatened. "That kind of scheduling really fouls up things in the shop where it counts. It causes a feast or famine environment-nothing to do for one month, then a deluge the next. It's terrible for the employees, not to mention the supervisors who are trying to run an efficient operation. Your idea may make the income statements look good for now, but the whole company will suffer in the long run." Chuck intervened. "OK, you guys, calm down. Tim may have a good idea or he may not, but at least it's worth looking into. I propose that you all work up two sets of figures, one assuming level production and one matching production with sales. We'll look at them both and see if Tim's idea really does produce better results. If it does, we'll check it further against other issues Pop is concerned about and then make a decision on which alternative is better for the firm." Table 3 Sales (units) Sales (unit price: $3,000). 50% cash.. 50% from prior month's sales....... Total cash receipts.. (continued) April Production in units Production costs (each = $2,000) Overhead.. Dividends and interest. Taxes Total cash payments. Cash flow. Beginning cash. Cumulative cash balance. Monthly loan or (repayment). Cumulative loan... Ending cash balance May $4,675,000 $ 125,000 Sales Forecast 500 $1,500,000 Cash Receipts Schedule $ 750,000 $1,500,000 $ 450,000 $1,200,000 Cash Payments Schedule 400 $ 800,000 $ 200,000 0 $ 150,000 $1,150,000 $1,000,000 $1,000,000 Cash Budget; Required Minimum Balance is $125,000 50,000 1,250,000 2,000,000 1,700,000 125,000 125,000 125,000 125,000 1,375,000 175,000 2,125,000 1,825,000 ($ 50,000) ($1,250,000) ($2,000,000) ($1,425,000) $3,425,000 $1,425,000 0 $ 125,000 $ 125,000 $ 400,000 1,000 $3,000,000 June 400 $ 800,000 $ 200,000 $1,500,000 $ 750,000 $1,500,000 $2,250,000 $3,000,000 0 0 1,000 $3,000,000 400 $ 800,000 $ 200,000 July 0 0 1,000 $3,000,000 August 400 $ 800,000 $ 200,000 0 $ 300,000 $1,300,000 500 250 $1,500,000 $ 750,000 $1,500,000 $ 750,000 $1,500,000 $1,500,000 $3,000,000 $2,250,000 400 $ 800,000 $ 200,000 $1,000,000 $2,000,000 0 250,000 400,000 650,000 September 0 0 $ 650,000 $ 375,000 $ 750,000 $ 1,125,000 400 $ 800,000 $ 200,000 $1,000,000 125,000 650,000 775,000 0 0 $ 775,000 Table 4 Total Current Assets First Year Table 5 Cumulative loan balance... Interest expense at (prime, 8.0%, +4.0%) 12.00% October.. November December January February March 125,000 125,000 125,000 125,000 125,000 125,000 125,000 125,000 400,000 August.. 650,000 September. 775,000 * Equals 50 percent of monthly sales April May June July.. April $4,675,000 Cumulative loan balance... Interest expense at (prime, 8.0%, +4.0%) 12.00%. Total interest expense for the year: $254,250 Accounts Receivable* $ 46,750 Cash $125,000 + $225,000 + $1,300,000 = $1,650,000 112,500 1,950,000 37,500 2,700,000 3,500,000 4,300,000 4,500,000 $ 12,125 0 0 450,000 750,000 1,500,000 1,500,000 1,500,000 750,000 375,000 May $3,425,000 June $1,425,000 $ 34,250 $ 14,250 Inventory 4,300,000 3,100,000 Cumulative loan balance and interest expense (1% per month) October $ 550,000 November December $1,212,500 $2,062,500 February $4,175,000 March $4,725,000 $ 5,500 $ 20,625 $ 41,750 $ 47,250 1,900,000 700,000 500,000 800,000 January $3,175,000 July $ 31,750 0 0 August Total Current Assets 0 0 2,187,500 2,862,500 3,625,000 4,425,000 5,075,000 5,175,000 4,725,000 3,525,000 2,600,000 1,900,000 1,950,000 September 0 0 Required Activities: 1. Reference tables 1 through 5 to complete the following: A. Reproduce these tables if Tim's suggestion were implemented; that is, change the Production This Month column in Table 2 from 400 each month to 150, 75, 25, and so on, to match Sales in the next column. B. Recompute the remainder of Table 2, and Tables 3, 4, and 5 based on the new production numbers. Note: Beginning inventory is still 400 units. Beginning cash is still $125,000 and that remains the minimum required balance. C. Write a one paragraph summary of what the new computations reflect and what you would suggest as a result of your findings. 2. Reference table 5 to calculate how much Tim's suggestion would save in interest expense in a year. A. Use your recomputed figures in Table 5 from question 1 to summarize what the change would offer as a savings from the total interest expense. Justify your perspective on whether those findings would be a positive point for Tim's suggestion or a positive point for Roy ("Pop"). 3. Assume that there is an added expense for each sales dollar of .5 percent (.005). Based on this fact and the information computed in question 2, is seasonal production justified? A. Compute the total sales using table 3 (original or recomputed table can be sued) B. Apply the added expense and identify what the expense amount will do (increase/decrease and by how much). C. Compare the rate of the added expense burden to the interest savings computed in question 2 of table5. D. Write a one paragraph summary of your findings. Include if you feel the seasonal production plan is justified or not and why you are making the formal recommendation to implement the change or not.
Expert Answer:
Answer rating: 100% (QA)
Navigating the 2014 Sales Landscape A Financial Analysis The company embarks on 2014 with an anticipated sales volume of 3300 units strategically dist... View the full answer

Related Book For 
The Economics Of Money Banking And Financial Markets
ISBN: 9780321584717
4th Canadian Edition
Authors: Frederic S. Mishkin, Apostolos Serletis
Posted Date:
Students also viewed these finance questions
-
a. Tables 1 through 5 contain the financial information describing the effects of level production on inventory, cash flow, loan balances, and interest expense. Reproduce these tables as if Tim's...
-
After graduating from Eastern University in Campus Town, USA with a degree in business, Michael Woods realized that he wanted to remain in Campus Town. After a number of unsuccessful attempts at...
-
Consider examples 9.2 and 9.3. Assume that social damage is quadratic as in the examples. Following section 9.2.3, assume that the regulator can only set a uniform tax. Determine the formula for the...
-
At 45 years of age, Seth figured he wanted to work only 10 more years. Being a full-time landlord had a lot of advantages: cash flow, free time, being his own boss-but it was time to start thinking...
-
Does the Mach number of a gas flowing at a constant velocity remain constant? Explain.
-
John J. Williams began working at Delaware Elevator as a branch sales manager in late 2004. The company manufactures components for elevators and installs and repairs elevators. It employs 175 people...
-
In 2010, Jennifer (Jen) Liu and Larry Mestas founded Jen and Larry's Frozen Yogurt Company, which was based on the idea of applying the microbrew or microbatch strategy to the production and sale of...
-
1. Consider two satellites S and S with periods of revolution 1hr. and 8 hr. respectively revolving around a planet in circular orbits. The ratio of angular velocity of satellite S to the angular...
-
The controller of Bridgeport Housewares Inc. instructs you to prepare a monthly cash budget for the next three months. You are presented with the following budget information: The company expects to...
-
Robert Evans owns a business, Beachside Realty, that rents condominiums and furnishings. Below is the adjusted trial balance at December 31: Robert Evans ADJUSTED TRIAL BALANCE December 31, 20--...
-
Discuss the need for a new discipline of supply chain management accounting.
-
Does Artificial Intelligence make management accountants obsolete?
-
Buy-Smart is a successful business-to-business wholesaler, serving the needs of traders, hotels, restaurants, caterers, and offices. They offer a wide variety of merchan-dise ranging from groceries,...
-
What is reputational risk, and why is it particularly impor-tant in a supply chain context?
-
How can netting and pooling be used in a supply chain? Why are these instruments more beneficial to internal supply chains that link firms/ subsidiaries of the same group?
-
A small block on a frictionless, horizontal surface has a mass of 2.60x10⁻² kg. It is attached to a massless cord passing through a hole in the surface (Figure 1). The block is originally revolving...
-
Fill in each blank so that the resulting statement is true. A solution to a system of linear equations in two variables is an ordered pair that__________ .
-
If consumer expenditure is related to consumers expectations of their average income in the future, will an income tax cut have a larger effect on consumer expenditure if the public expects the tax...
-
Visit the website of the Bank of Canada, www.bankofcanada.ca. Click Rates and Statistics and then Exchange Rates. a. What are the fundamental determinants of exchange rates? b. What are the different...
-
If velocity and aggregate output remain constant at 5 and $1,000 billion, respectively, what happens to the price level if the money supply declines from $400 billion to $300 billion?
-
A national news organization developed the graphic shown in Figure 22 to illustrate the change in the highest marginal tax rate effective January 1, 2013. Why might this graph be considered...
-
A home security company located in Minneapolis, Minnesota, develops a summer ad campaign with the slogan When you leave for vacation, burglars leave for work. According to the city of Minneapolis,...
-
The time-series graph in Figure 24 depicts the number of residents in the United States living in poverty. Why might this graph be considered misrepresentative? Approach Look for any characteristics...

Study smarter with the SolutionInn App